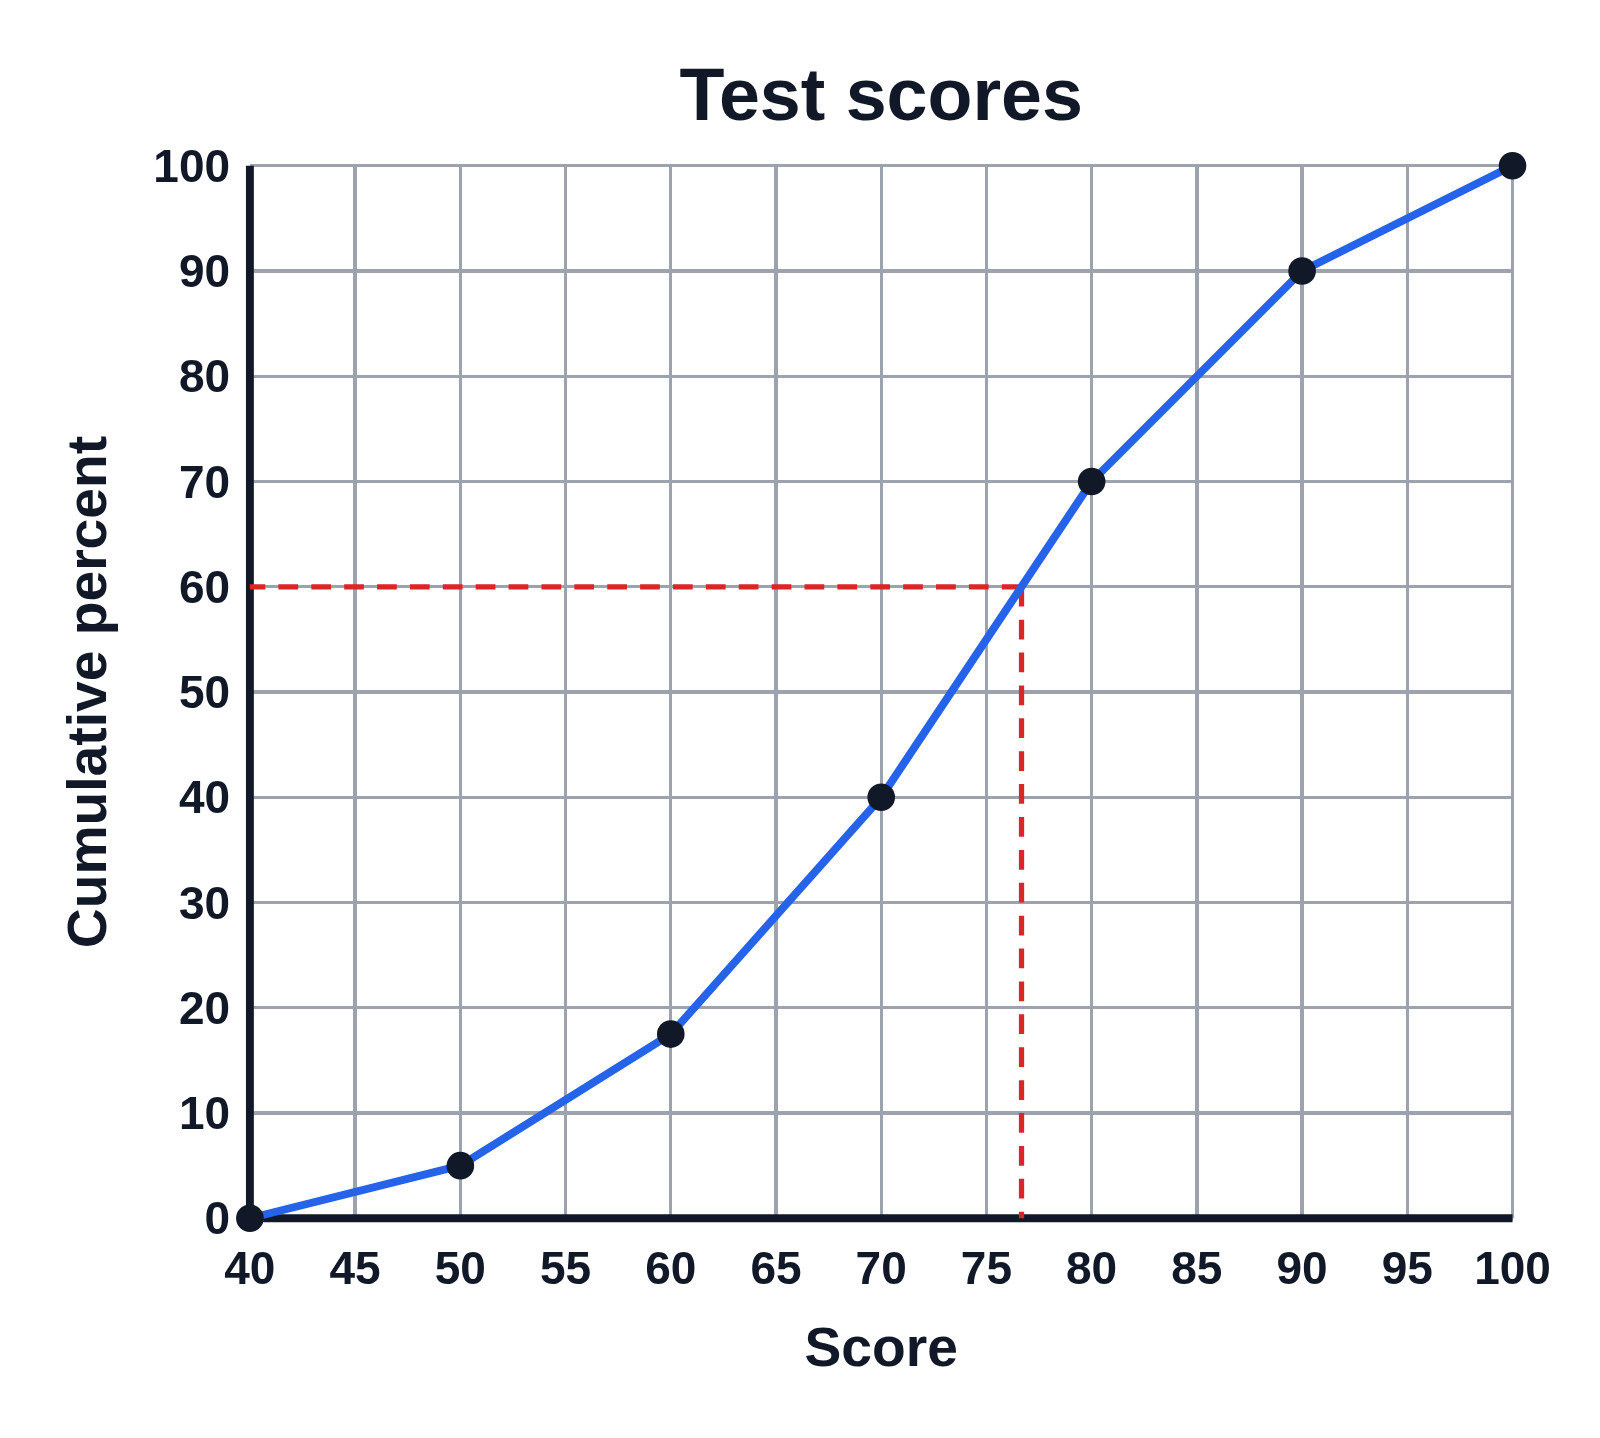
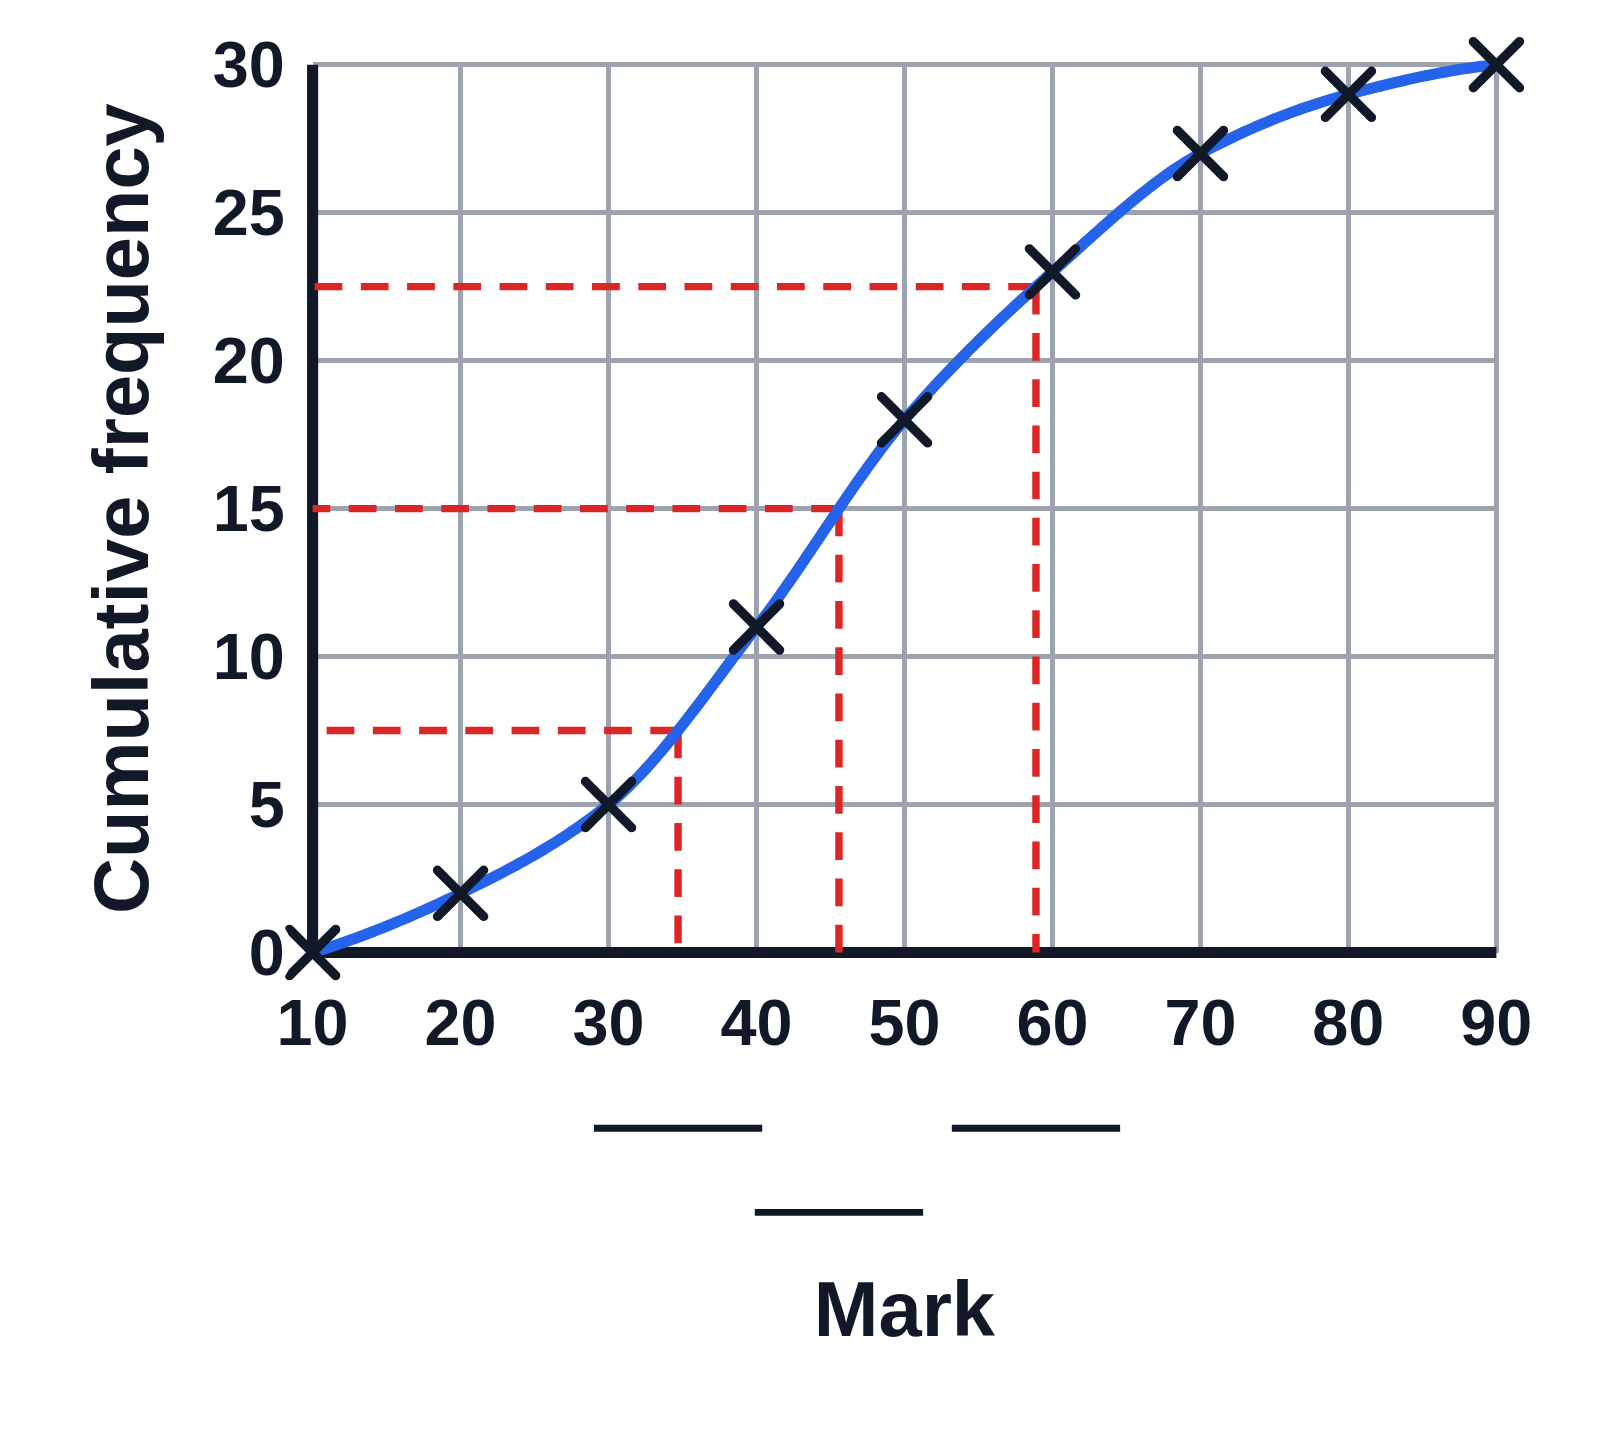
An ogive titled Test scores, with scores from 40 to 100 by 5 along the bottom and a cumulative percent axis from 0 to 100 by 10. Dots at 0% for 40, then 5%, 17.5%, 40%, 70%, 90% and 100% at each upper bound from 50 to 100, are joined by straight blue lines. Dashed red lines go across from 60% to the line and down to the score axis, with no value written, so students read the 60th percentile.