Math figures for your tests and worksheets
Make one to fit your lesson, then copy it straight into your document. Free, with no sign-up.
-
Coordinate Grid Generator
Square grids with x- and y-axes, for graphing lines, curves, piecewise and trig functions, inequalities and points.
-
Composite Shape EditorEditor
Build an L-shape or any shape from rectangles, triangles and semicircles.
-
Number Line Generator
Number lines with any range, with inequalities, points and sequences on them.
-
Triangle Generator
Triangles drawn to scale from their sides and angles, labeled for students.
-
Rectangle Generator
Rectangles and squares drawn to scale, labeled for students.
-
Parallelogram Generator
Parallelograms and rhombi drawn to scale, with parallel arrows.
-
Trapezoid Generator
Trapezoids, including right and isosceles ones, drawn to scale and labeled.
-
Kite Generator
Kites drawn to scale, with their equal sides marked and labeled.
-
Regular Polygon Generator
Regular polygons from 3 to 20 sides, with their apothem and radius.
-
Angles Generator
Rays out from one vertex, from a single angle to angles around a point, labeled right on the figure.
-
Parallel Lines and Transversal Generator
Parallel lines cut by any number of transversals, with angles you label right on the figure.
-
Circle Generator
A circle with points, chords, radii and tangents, its angles, arcs and areas labeled right on the figure.
-
Prism Generator
Rectangular, triangular and other prisms drawn to scale, labeled for students.
-
Cylinder Generator
Right and oblique cylinders drawn to scale, with the radius and height labeled.
-
Pyramid Generator
Square, rectangular and other pyramids with their height and slant height labeled.
-
Cone Generator
Right and oblique cones with their radius, height and slant height labeled.
-
Sphere Generator
Spheres and hemispheres with their radius or diameter labeled.
-
Box Plot Generator
Box plots from a list of numbers, one or several over the same number line.
-
Bar Graph Generator
Bar graphs and column graphs from a table, with one or several bars per category.
-
Stem-and-Leaf Plot Generator
Stem-and-leaf plots from a data set, single or back-to-back, with a key.
-
Cumulative Frequency Graph Generator
Cumulative frequency curves from a frequency table, with the median and quartiles read off.
-
Two-Way Table Generator
Two-way tables with totals, cells left blank for students, and relative frequencies.
-
Histogram Generator
Histograms from a data set or a frequency table, with equal or unequal bins.
-
Venn Diagram Generator
Venn diagrams of one, two or three sets, with numbers or elements in each region and regions shaded.
-
Pie Chart Generator
Pie charts from a table, with sectors labeled by name, value, percent or angle.
-
Mapping Diagram Generator
Mapping diagrams from a list of inputs and outputs, with arrows between them.
-
Length Reading Generator
A metric or imperial ruler with an object lying along it, to measure.
-
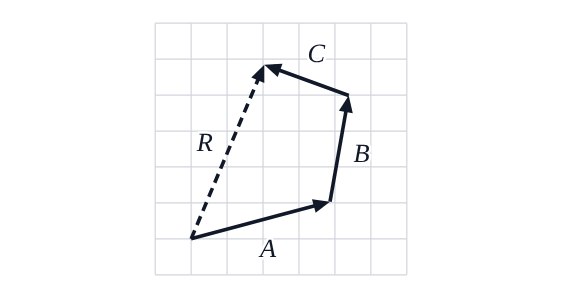
Vector Diagram Generator
Up to three vectors head to tail on a grid, with their resultant.
Physics Figures