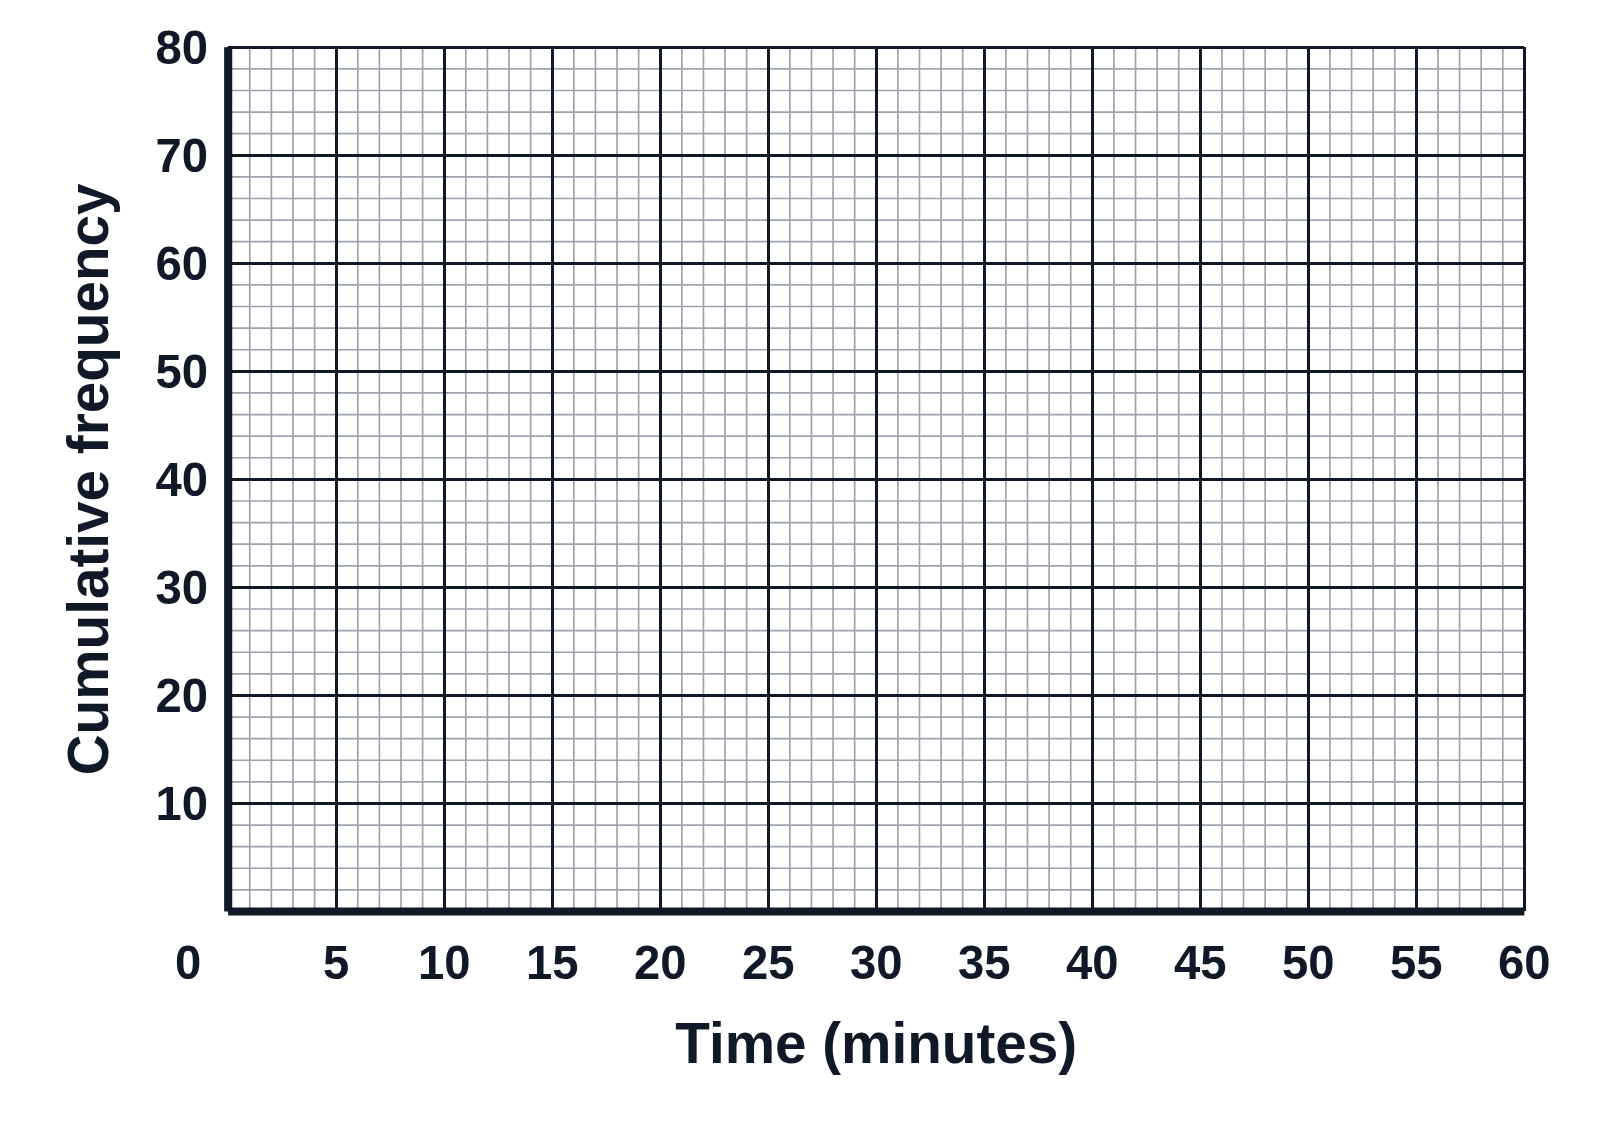
Cumulative frequency graph: estimate how many from the curve

An example figure from the Cumulative Frequency Graph Generator.

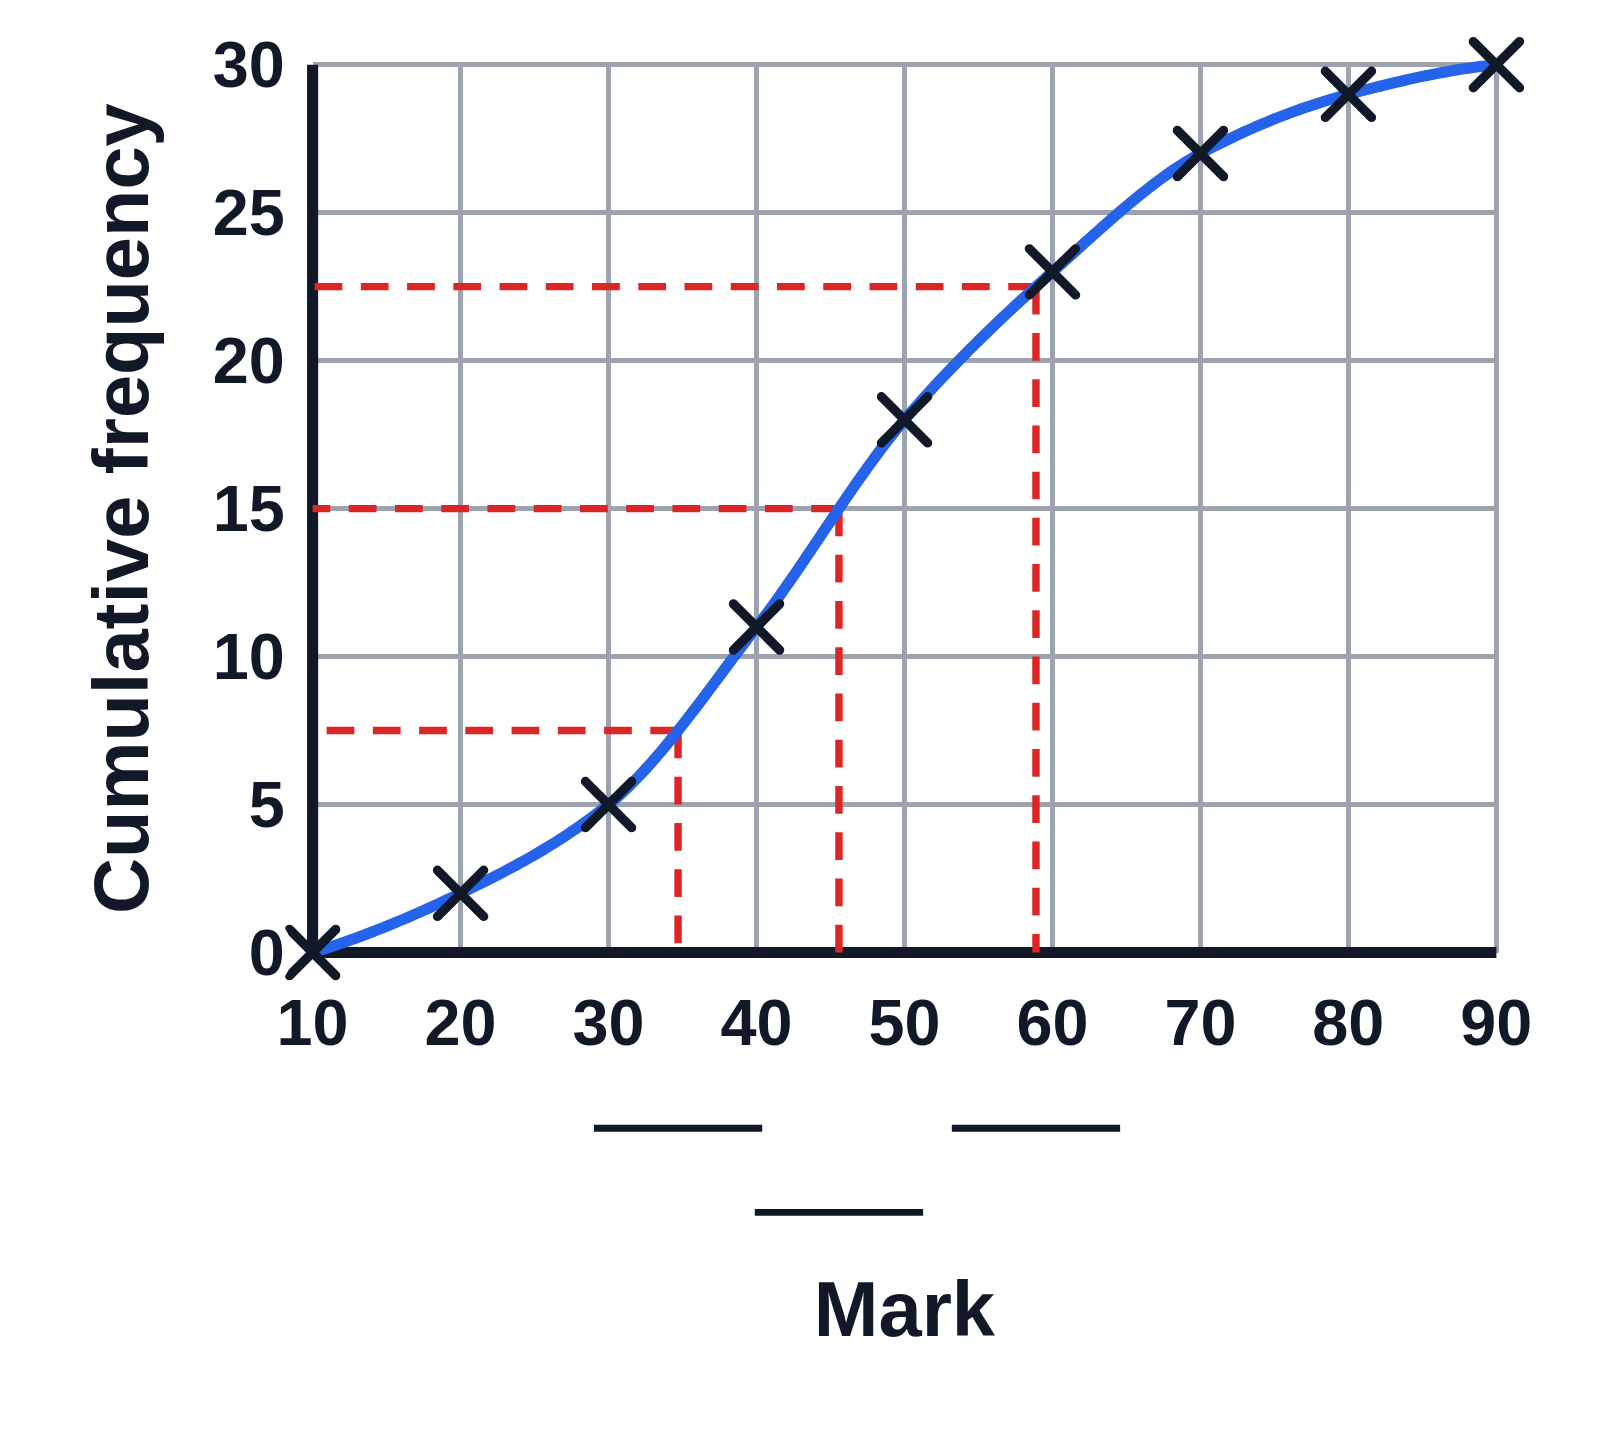
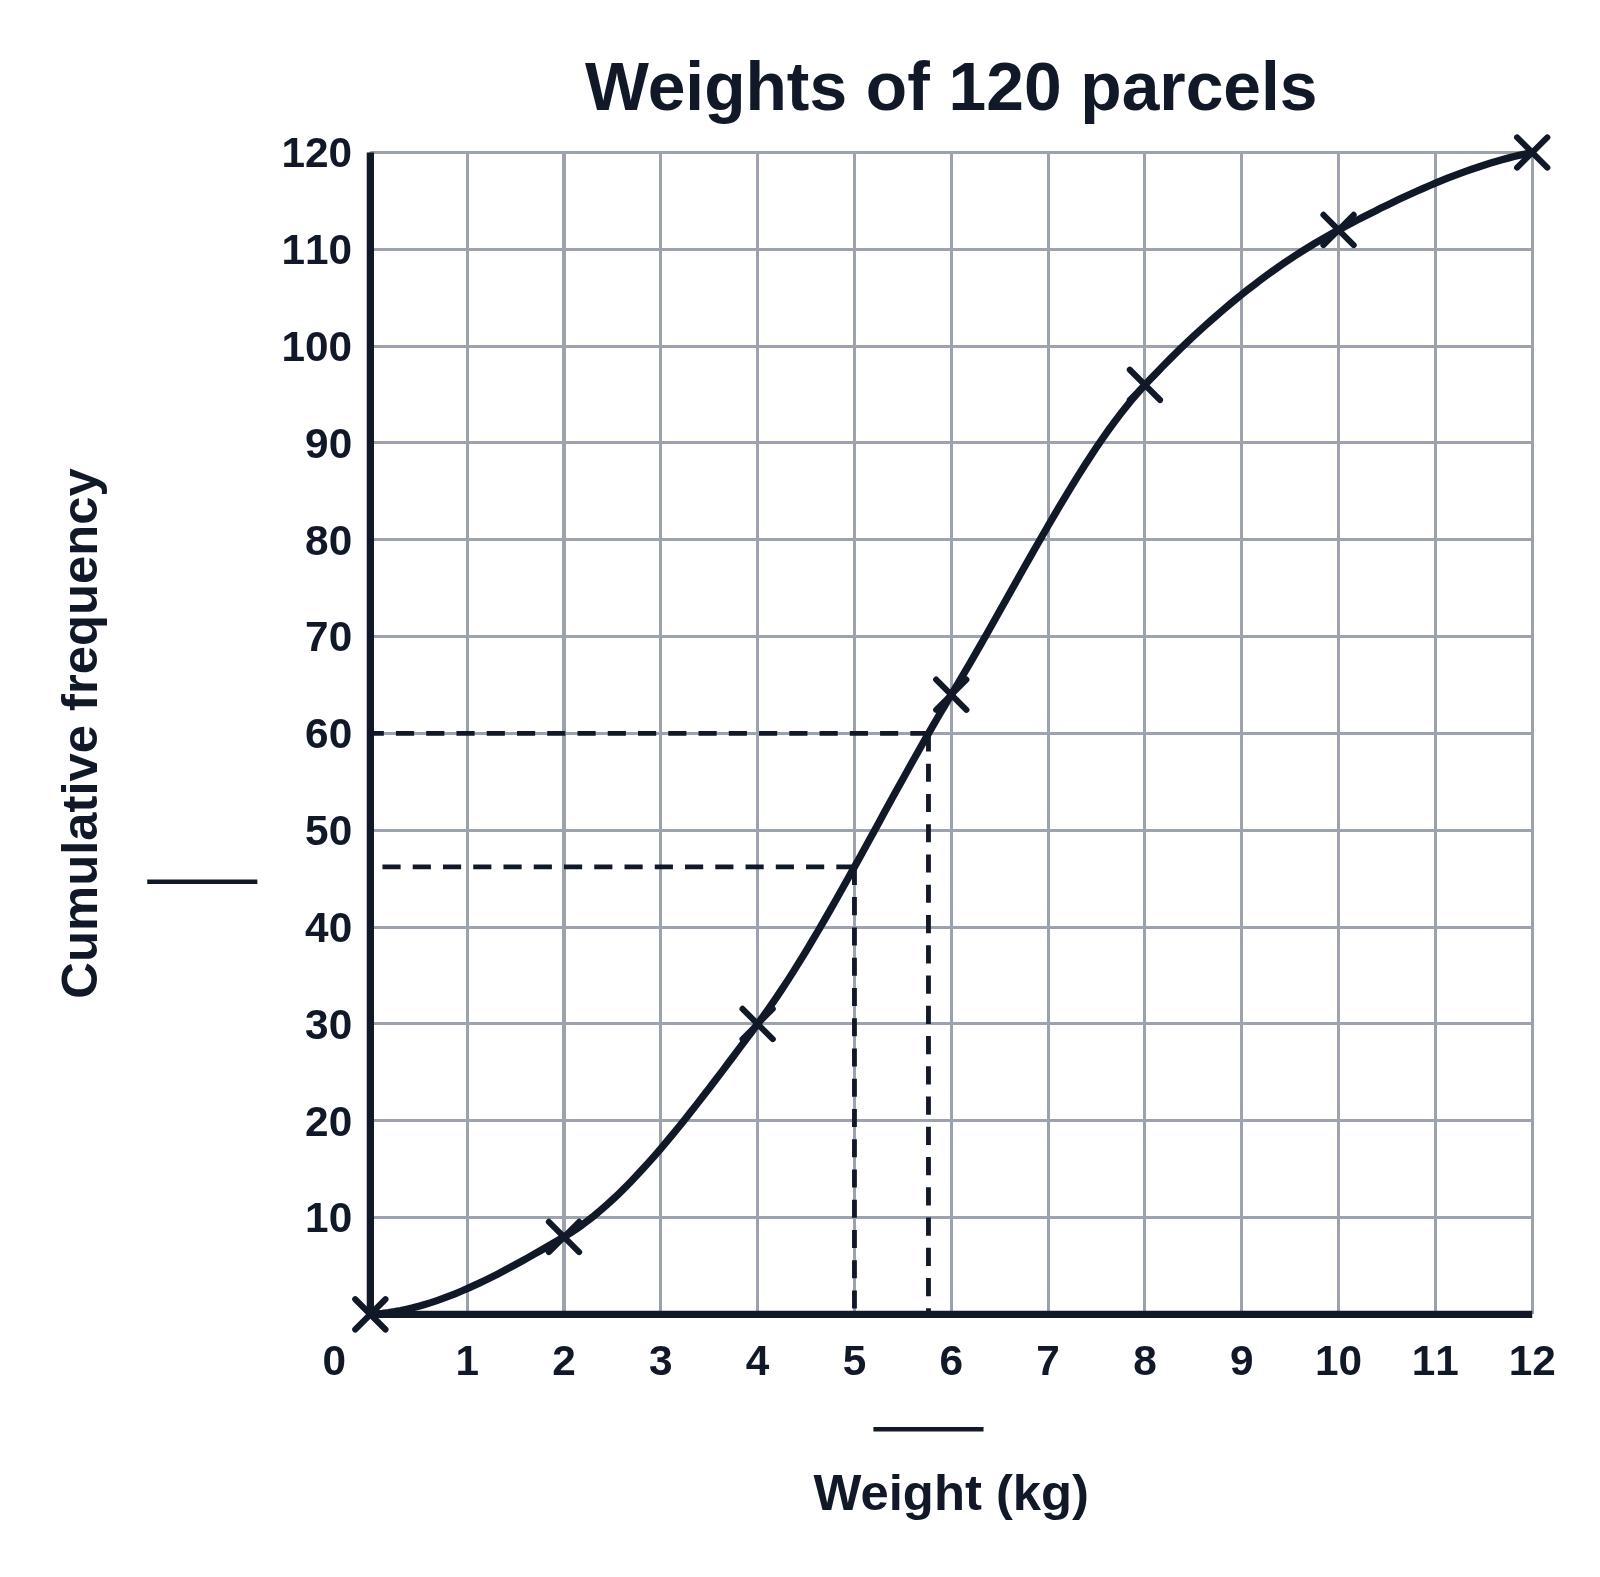
A black-and-white cumulative frequency curve titled Weights of 120 parcels, with dashed lines for the median and up from 5 kg, and blank lines at the axes for the answers
A cumulative frequency curve in black and white titled Weights of 120 parcels, over a weight axis from 0 to 12 kg by 1 and a cumulative frequency axis from 0 to 120 by 10, with crosses at 0 parcels for 0 kg, then 8, 30, 64, 96, 112 and 120 parcels every 2 kg up to 12. Dashed lines go across from 60 to the curve and down for the median, and up from 5 kg and across for how many parcels weigh 5 kg or less. A blank line under the weight axis and another left of the frequency axis are for students’ answers.

Editing opens it in the Cumulative Frequency Graph Generator with these settings, to change anything and copy or download your own.

Answer key

  • Median: 5.8
  • Up from 5: 46

Free to use in your tests, worksheets, slides or anything else, no credit needed. Public domain under CC0 1.0. How to reuse our figures

More Cumulative Frequency Graph examples