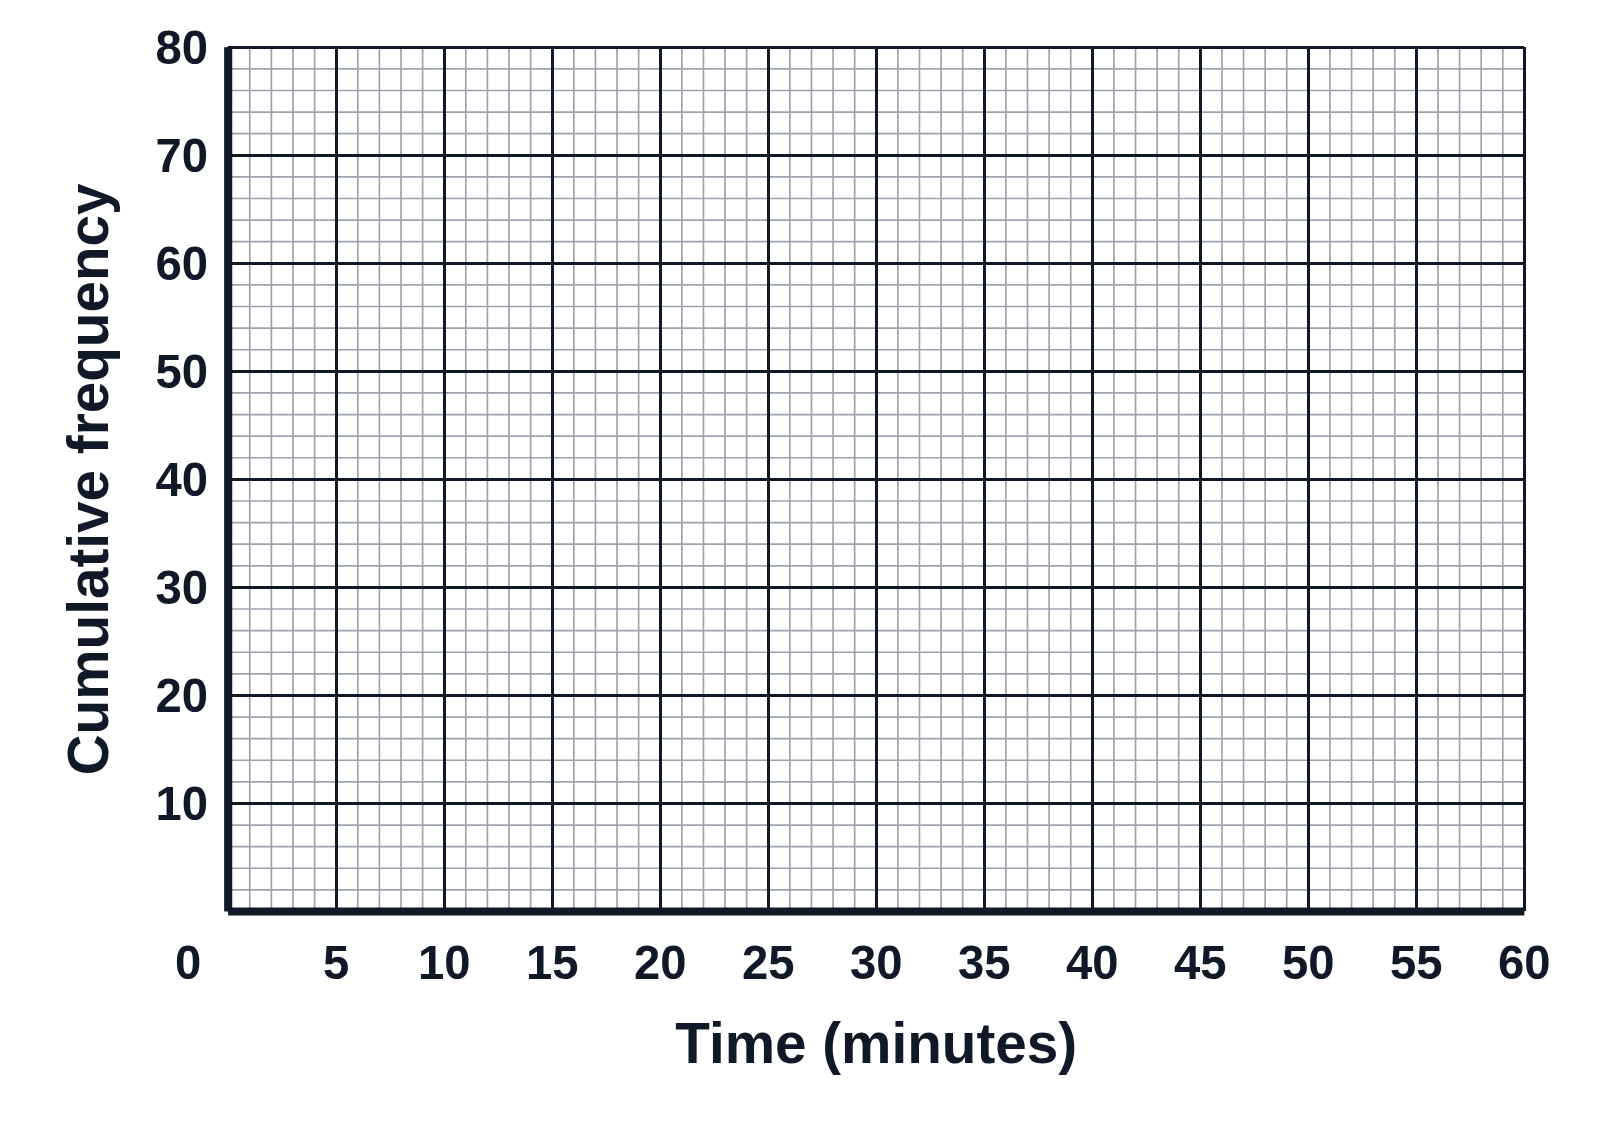
Cumulative frequency curve with the median and quartiles

An example figure from the Cumulative Frequency Graph Generator.

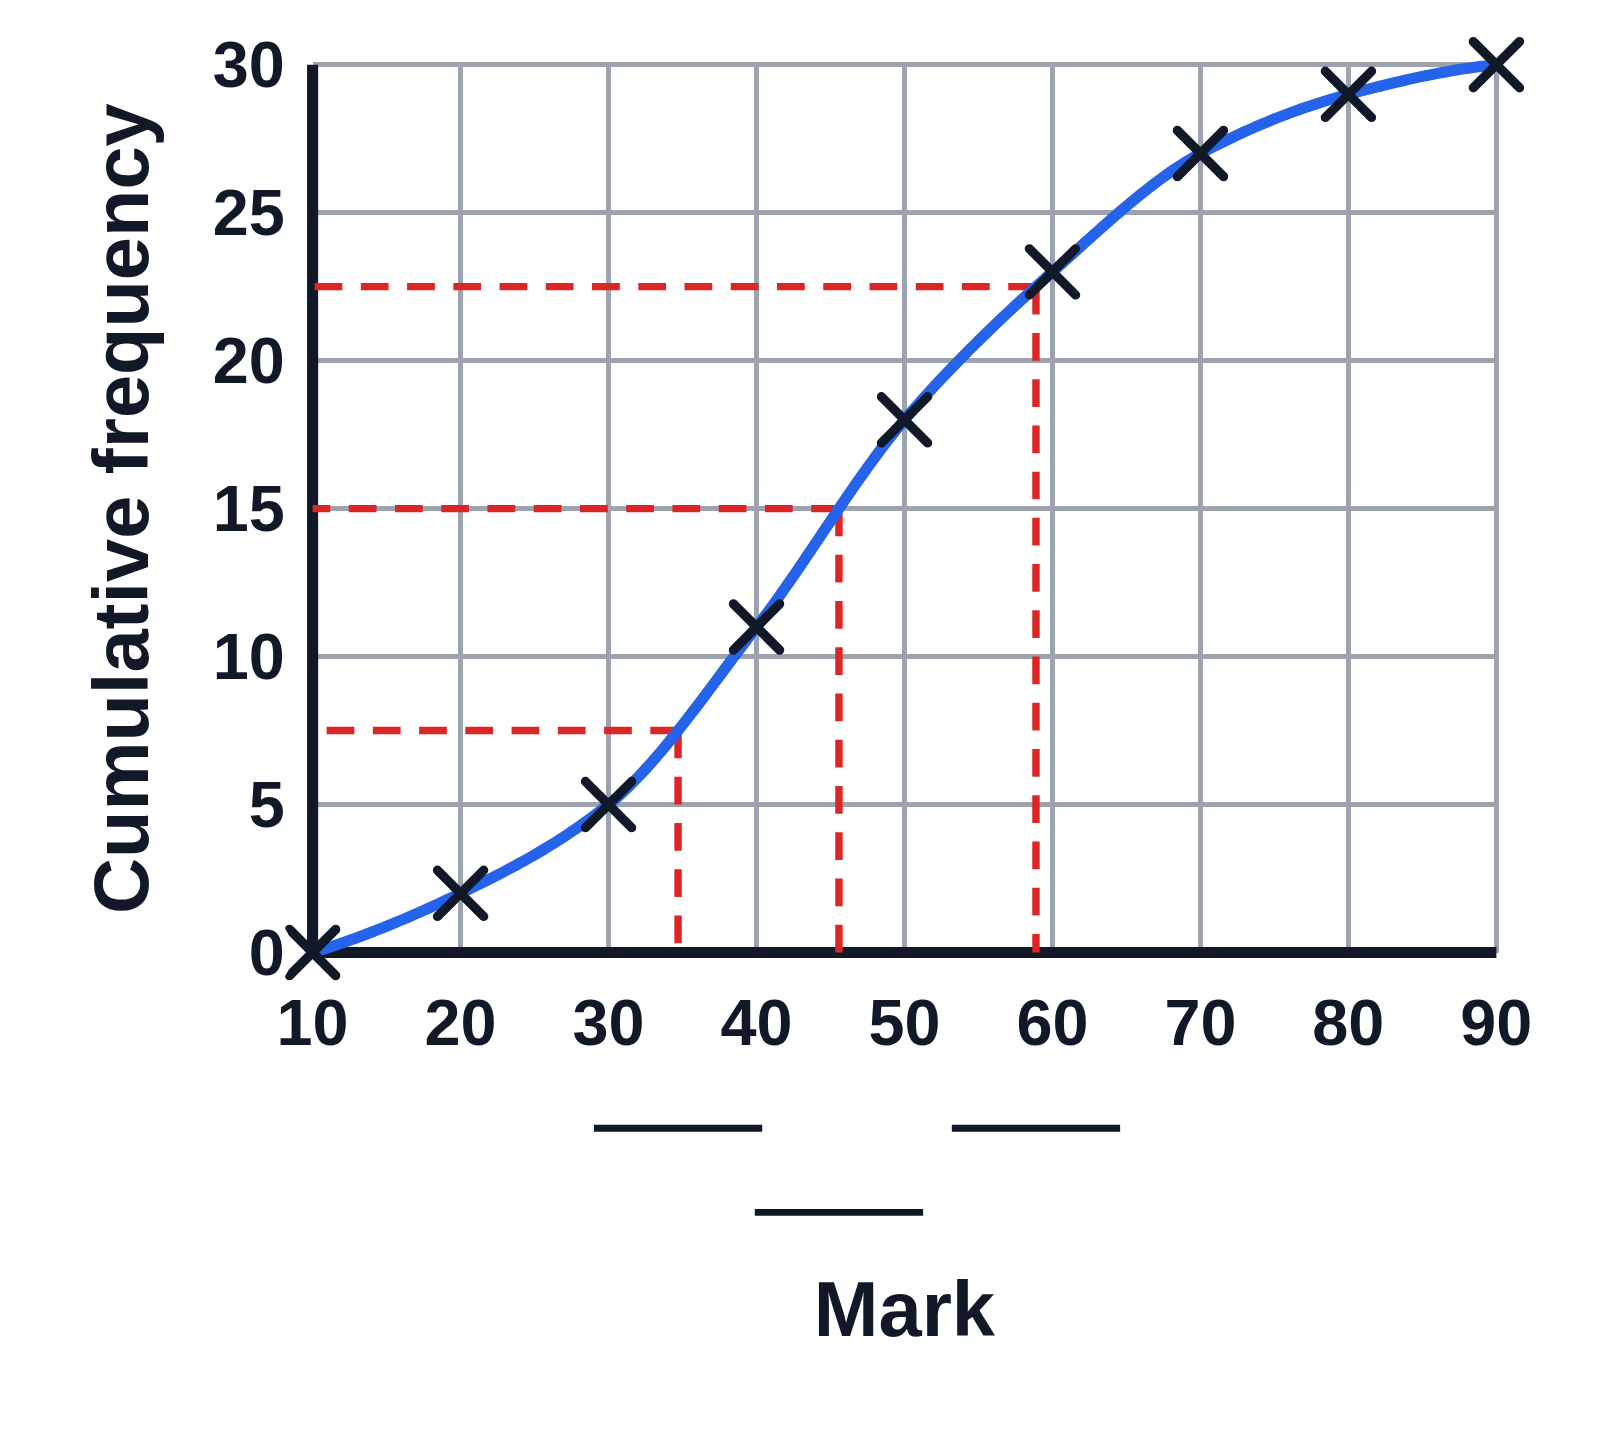
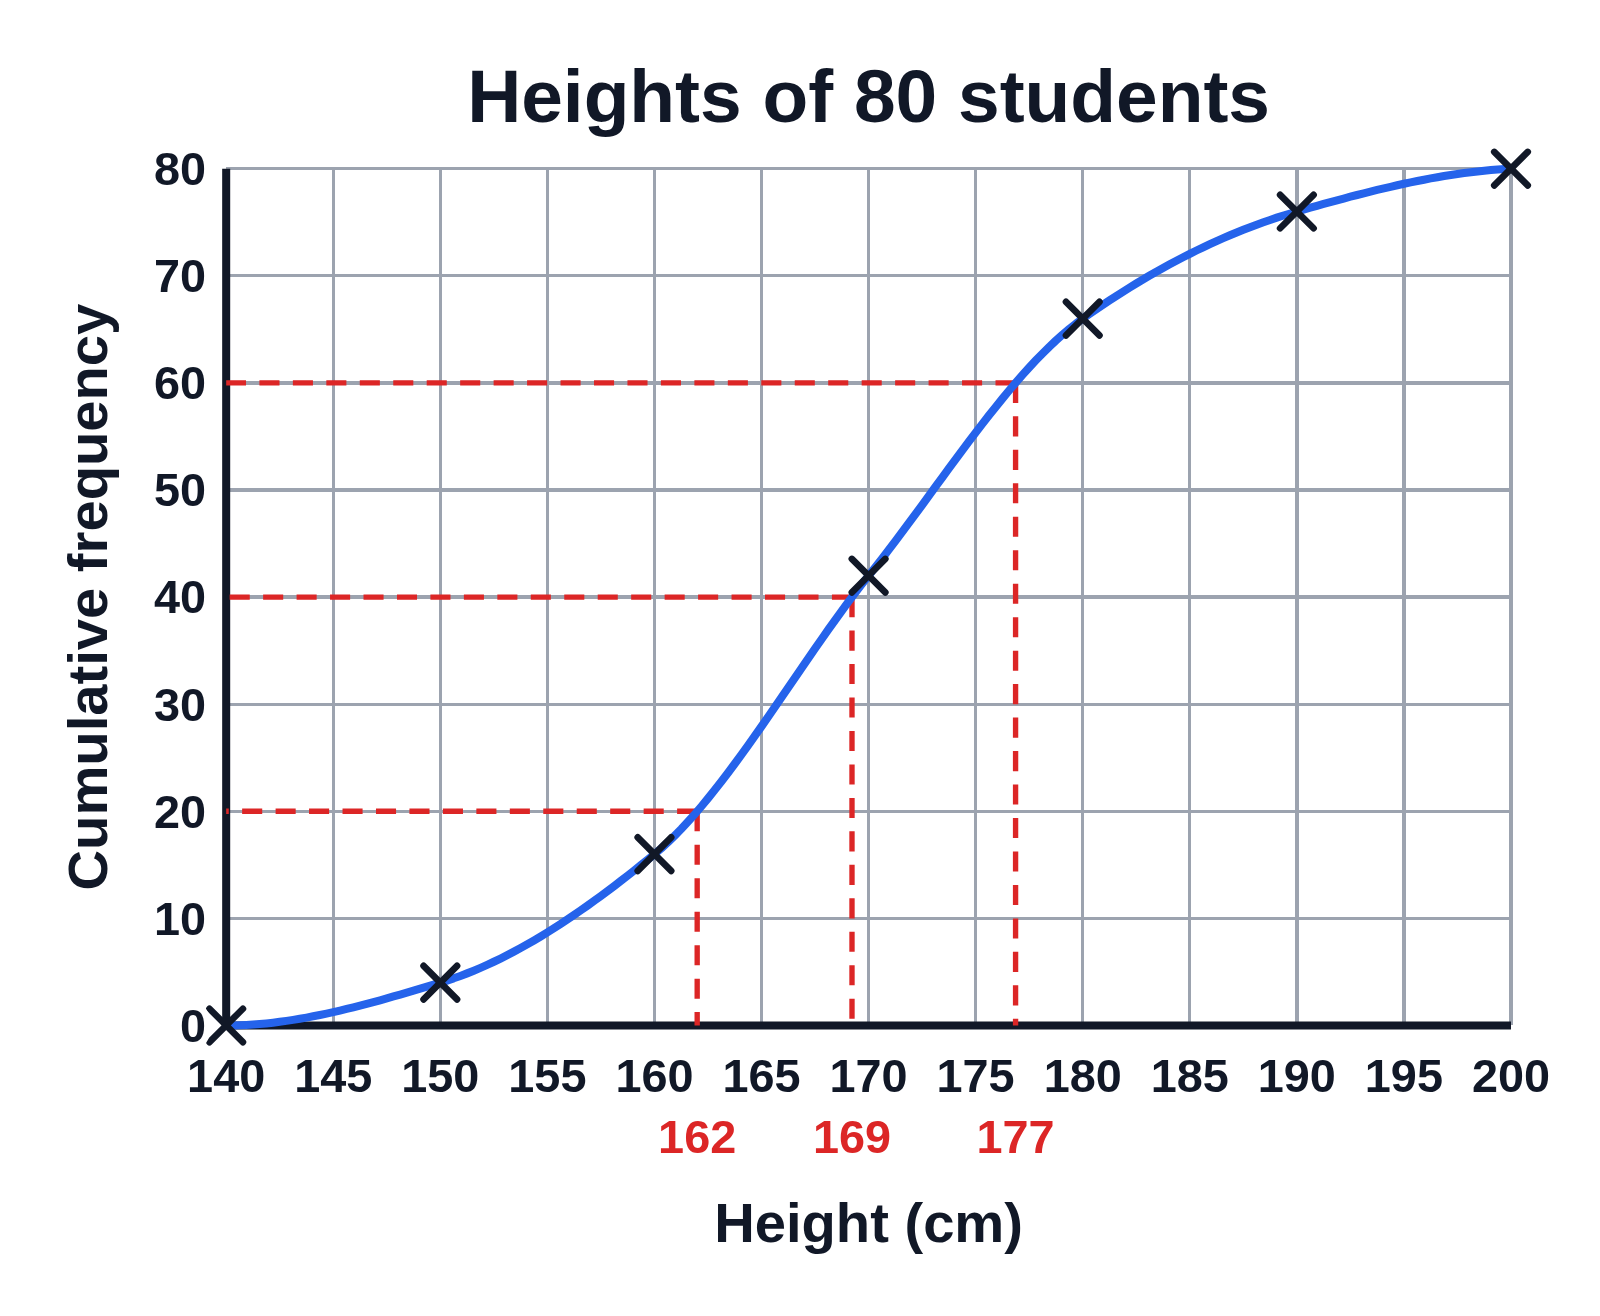
A cumulative frequency curve titled Heights of 80 students, with dashed red lines reading off the median, 169, and the quartiles, 162 and 177, written under the height axis
A cumulative frequency curve titled Heights of 80 students, over a height axis from 140 to 200 cm by 5 and a cumulative frequency axis from 0 to 80 by 10. Crosses mark the running totals at each upper bound, starting from 0 at 140, joined by a smooth blue curve. Dashed red lines go across from 20, 40 and 60 to the curve and down, with the lower quartile 162, the median 169 and the upper quartile 177 written under the axis.

Editing opens it in the Cumulative Frequency Graph Generator with these settings, to change anything and copy or download your own.

Free to use in your tests, worksheets, slides or anything else, no credit needed. Public domain under CC0 1.0. How to reuse our figures

More Cumulative Frequency Graph examples