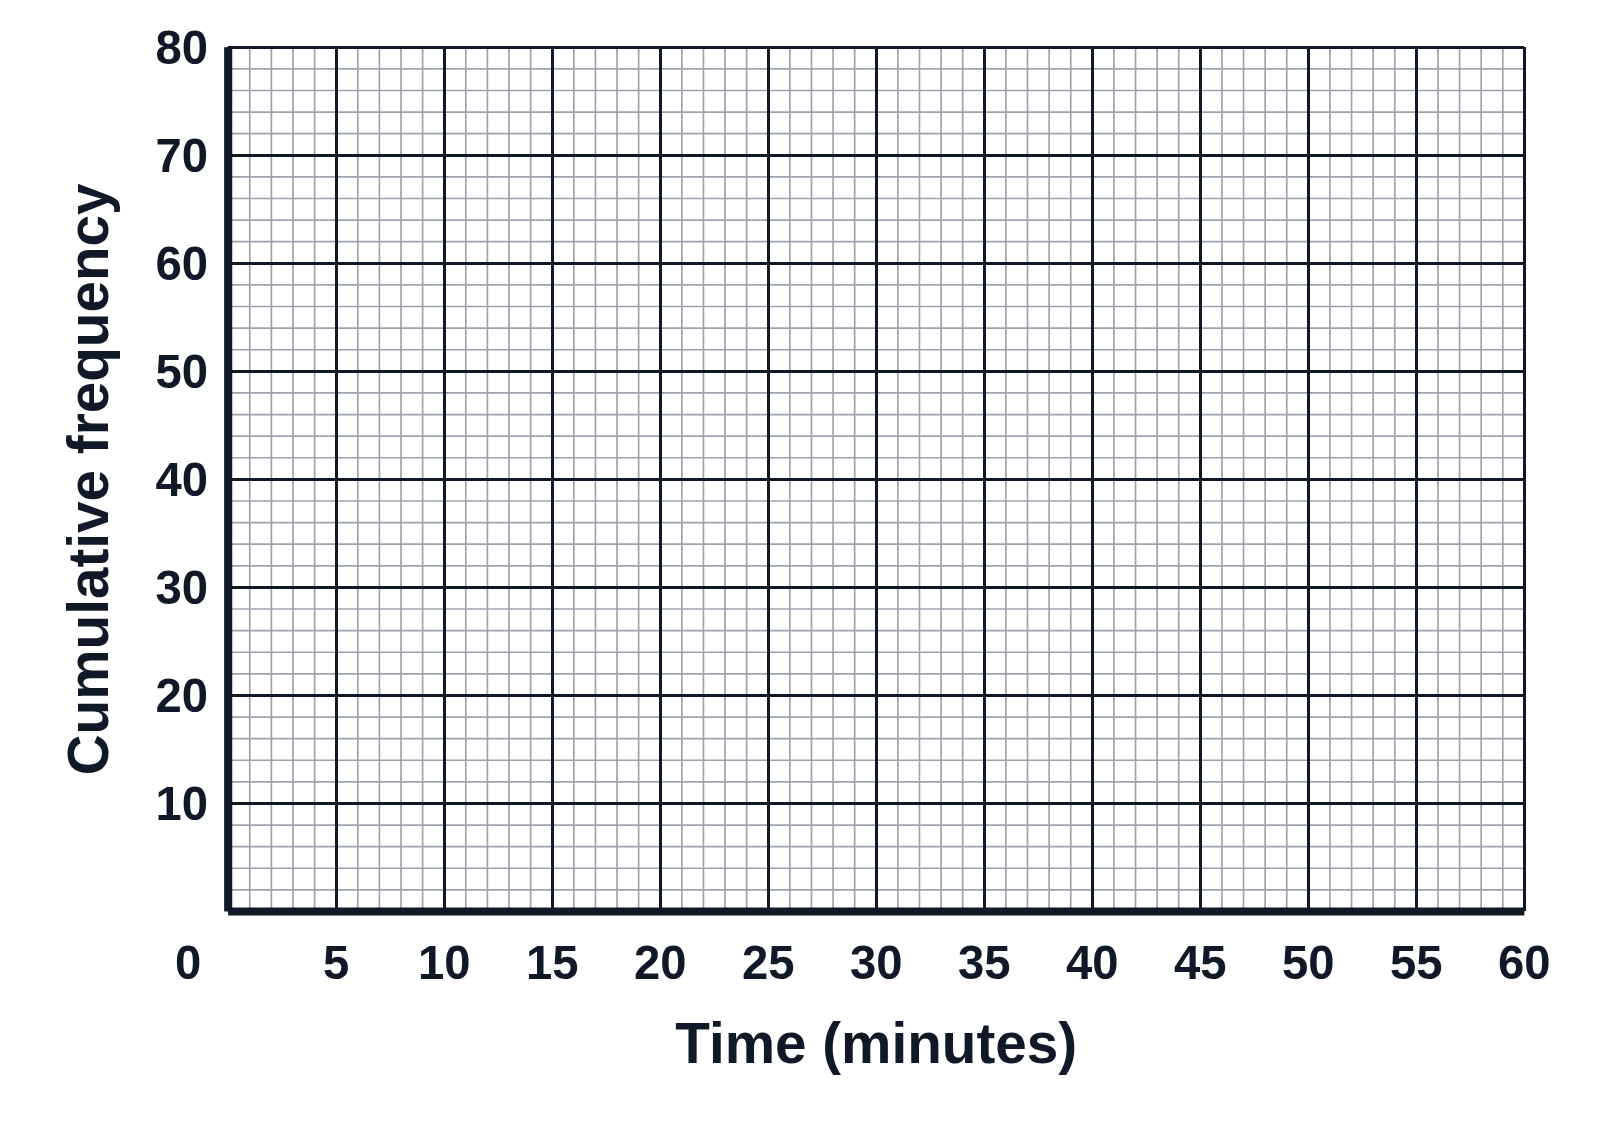
Cumulative frequency points for students to draw the curve

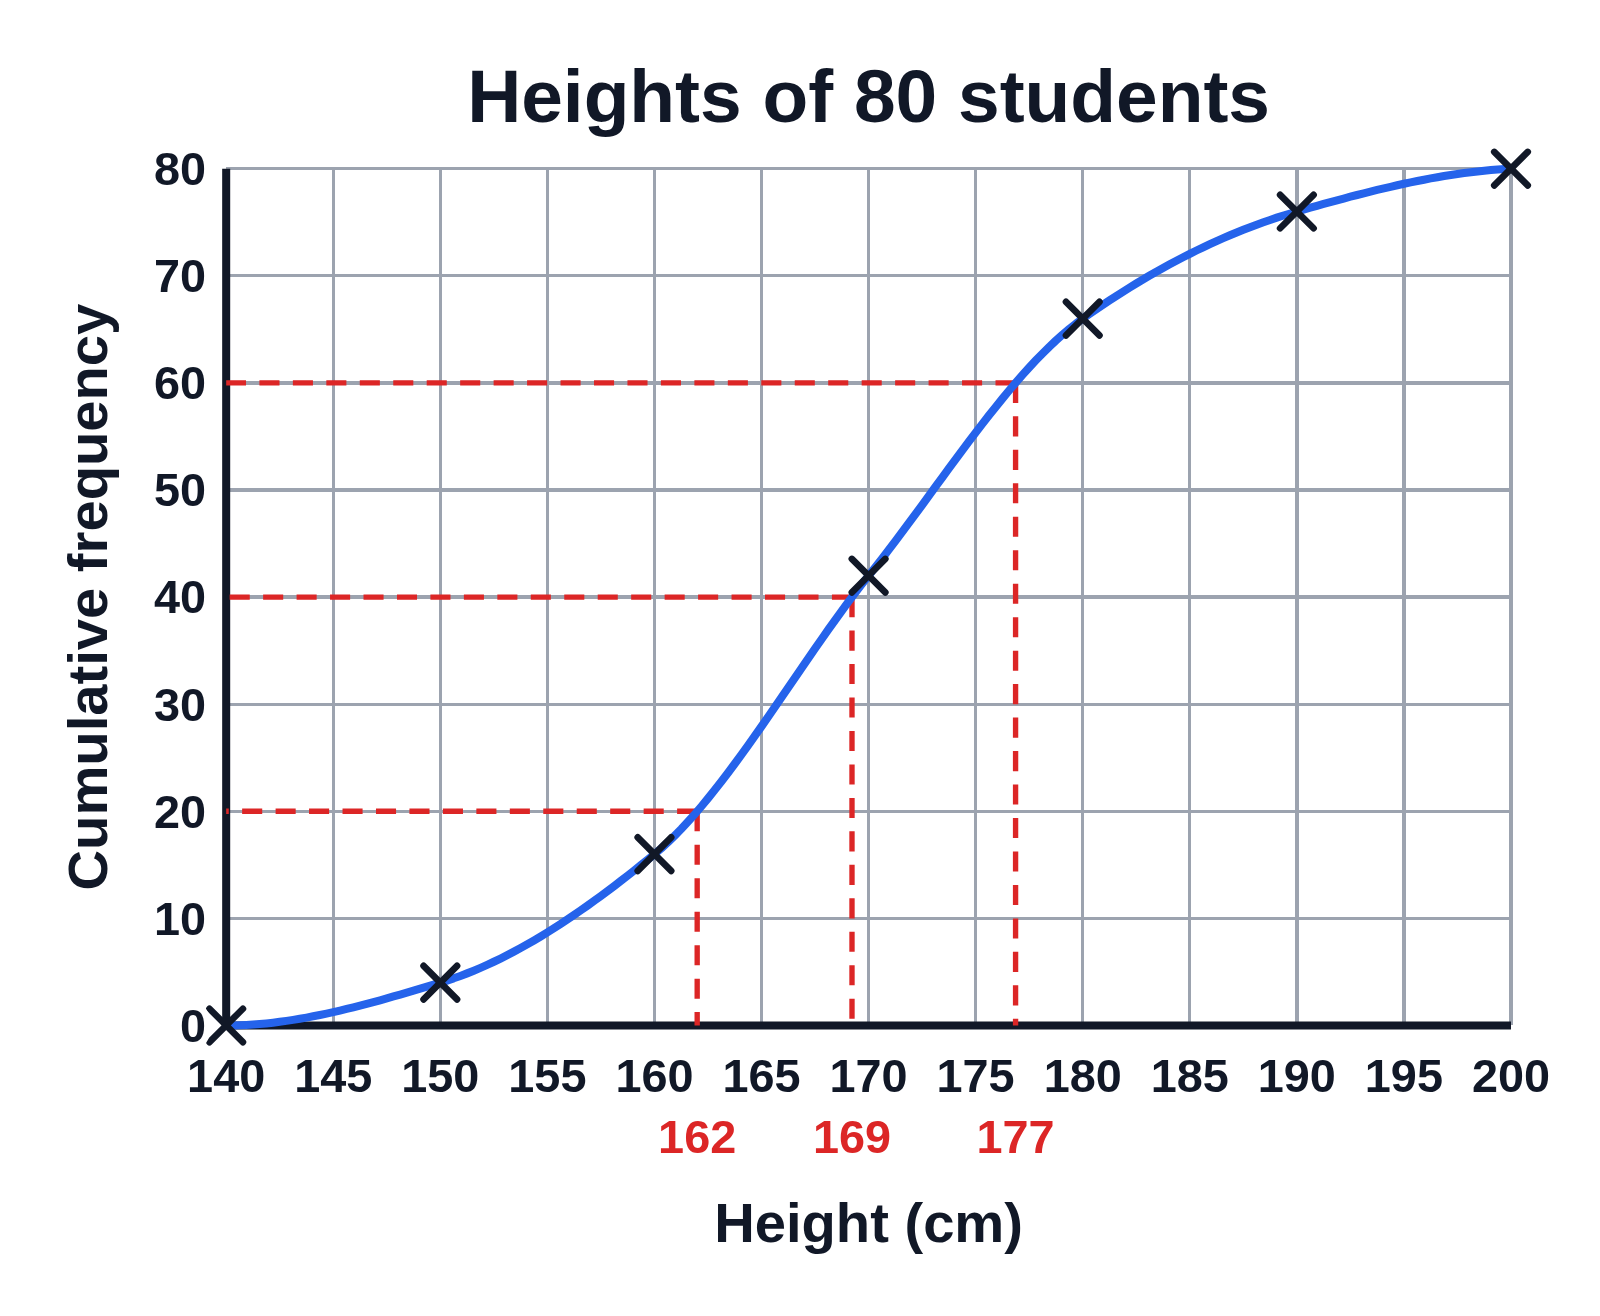
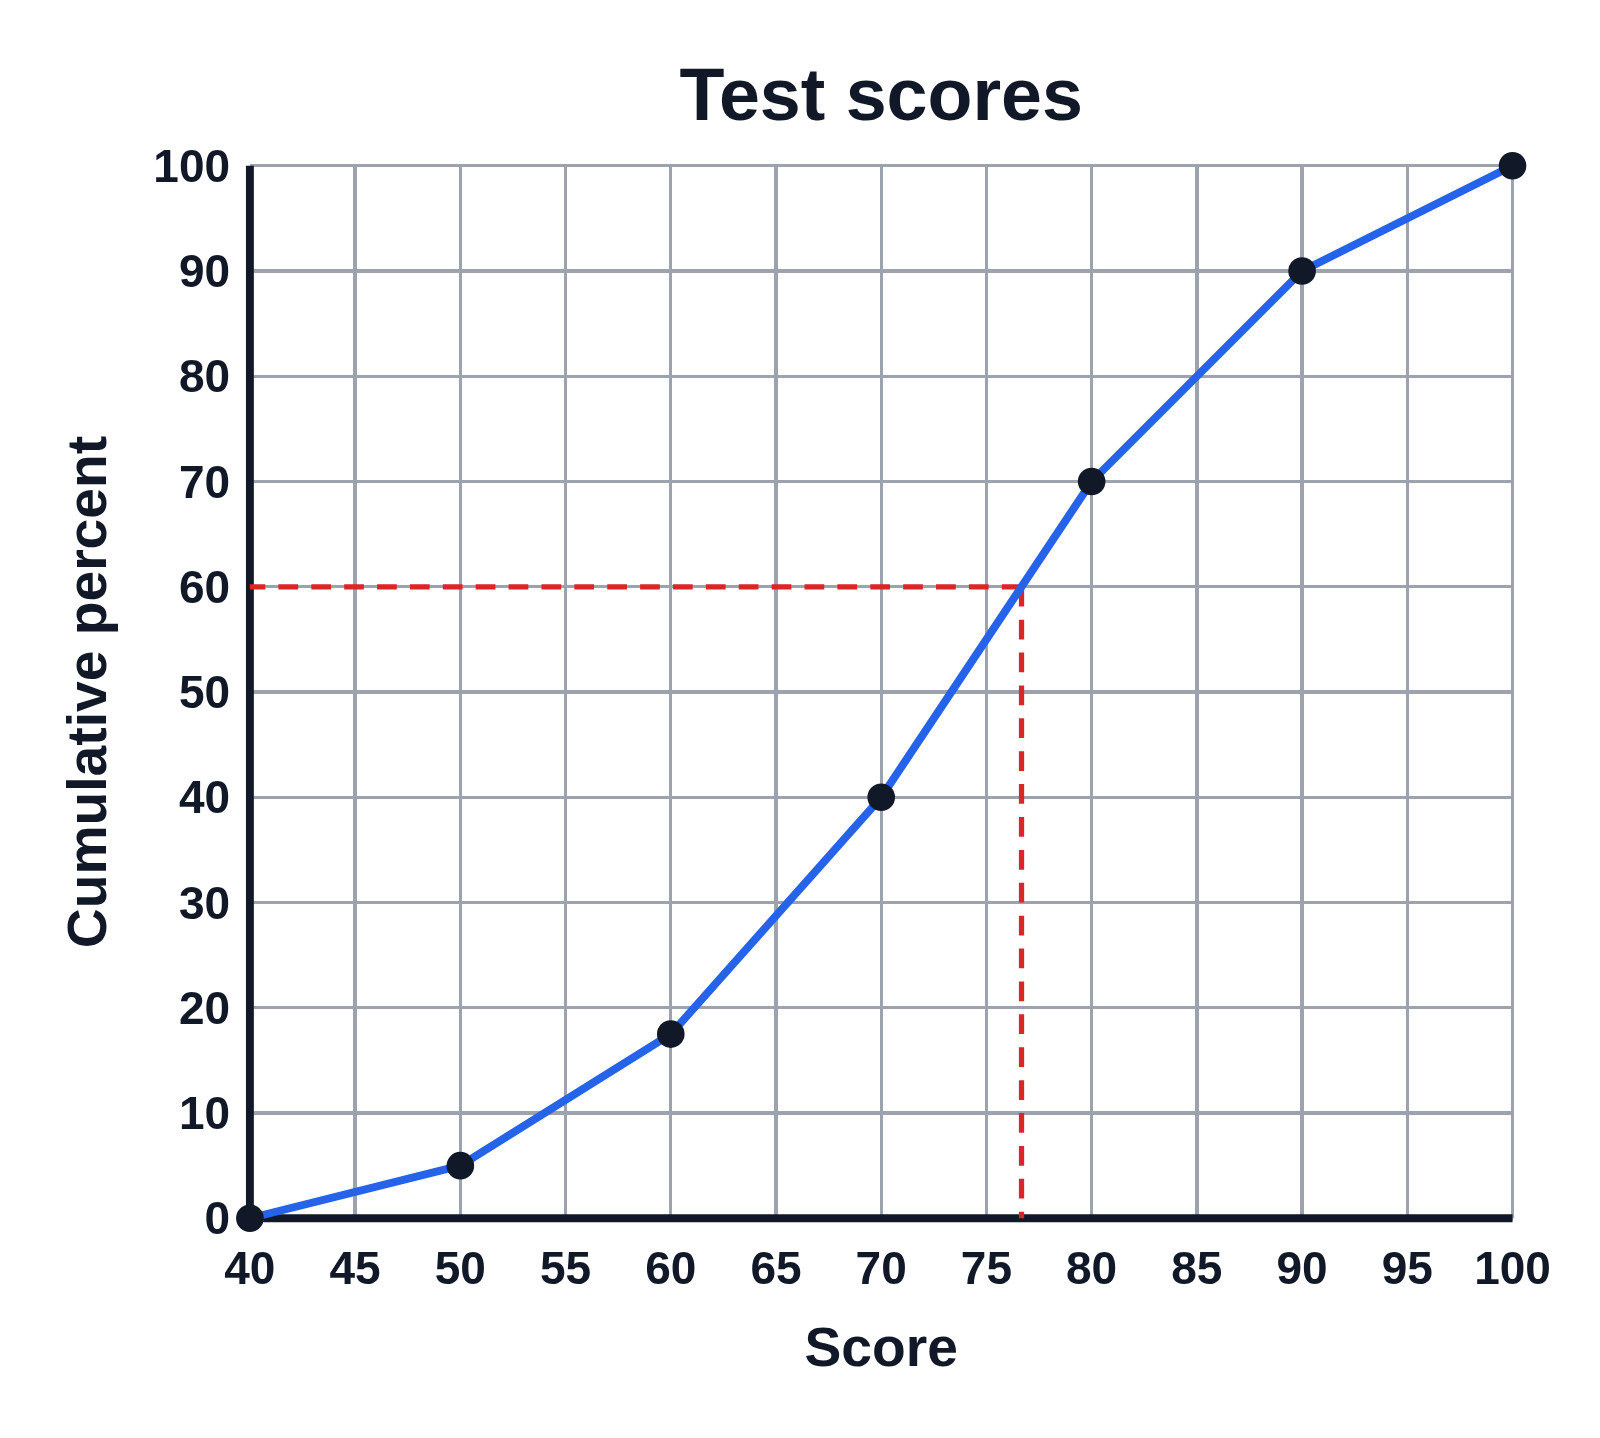
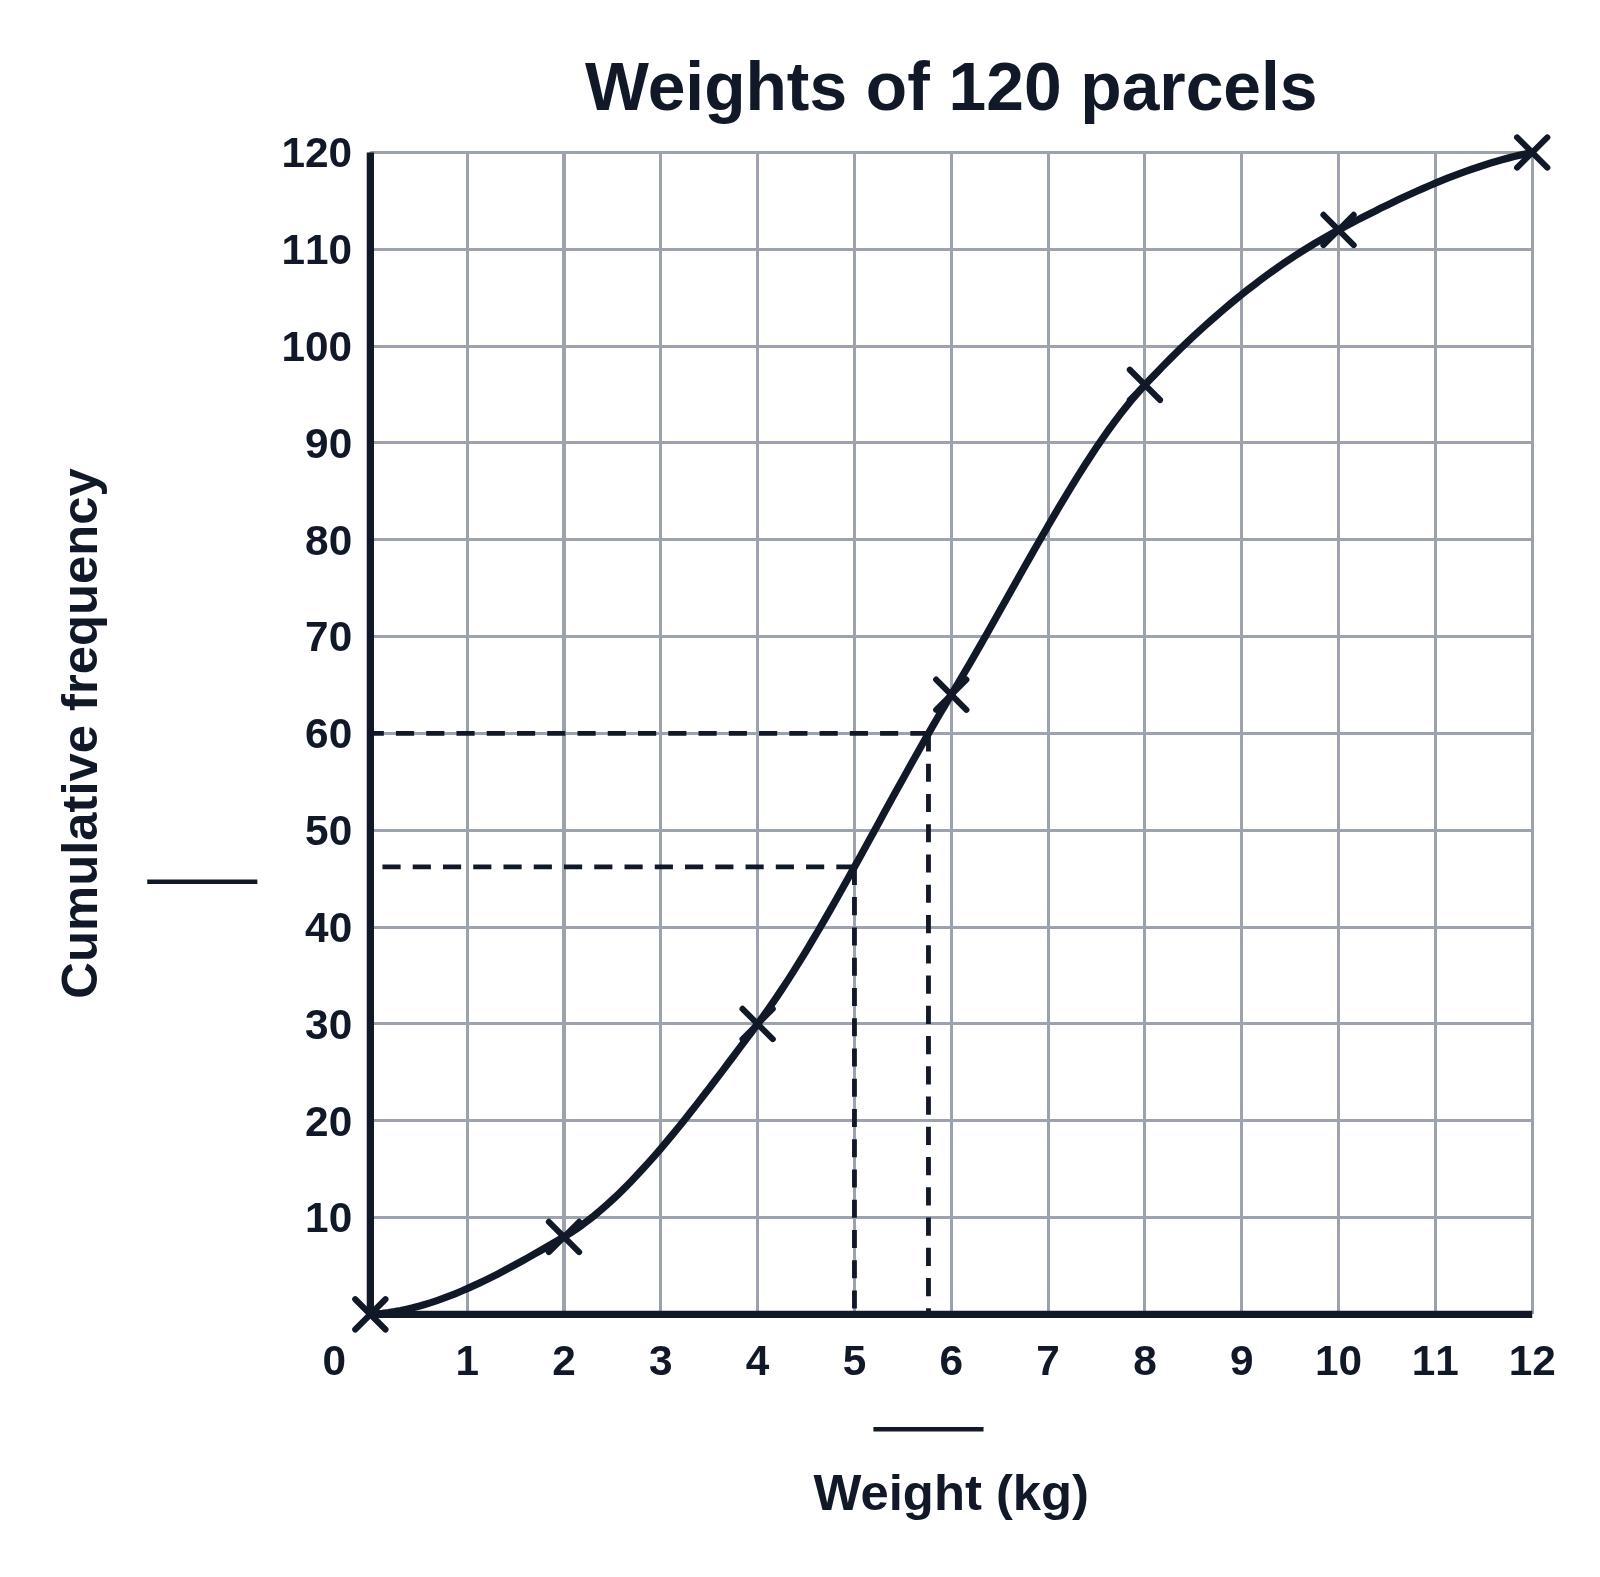
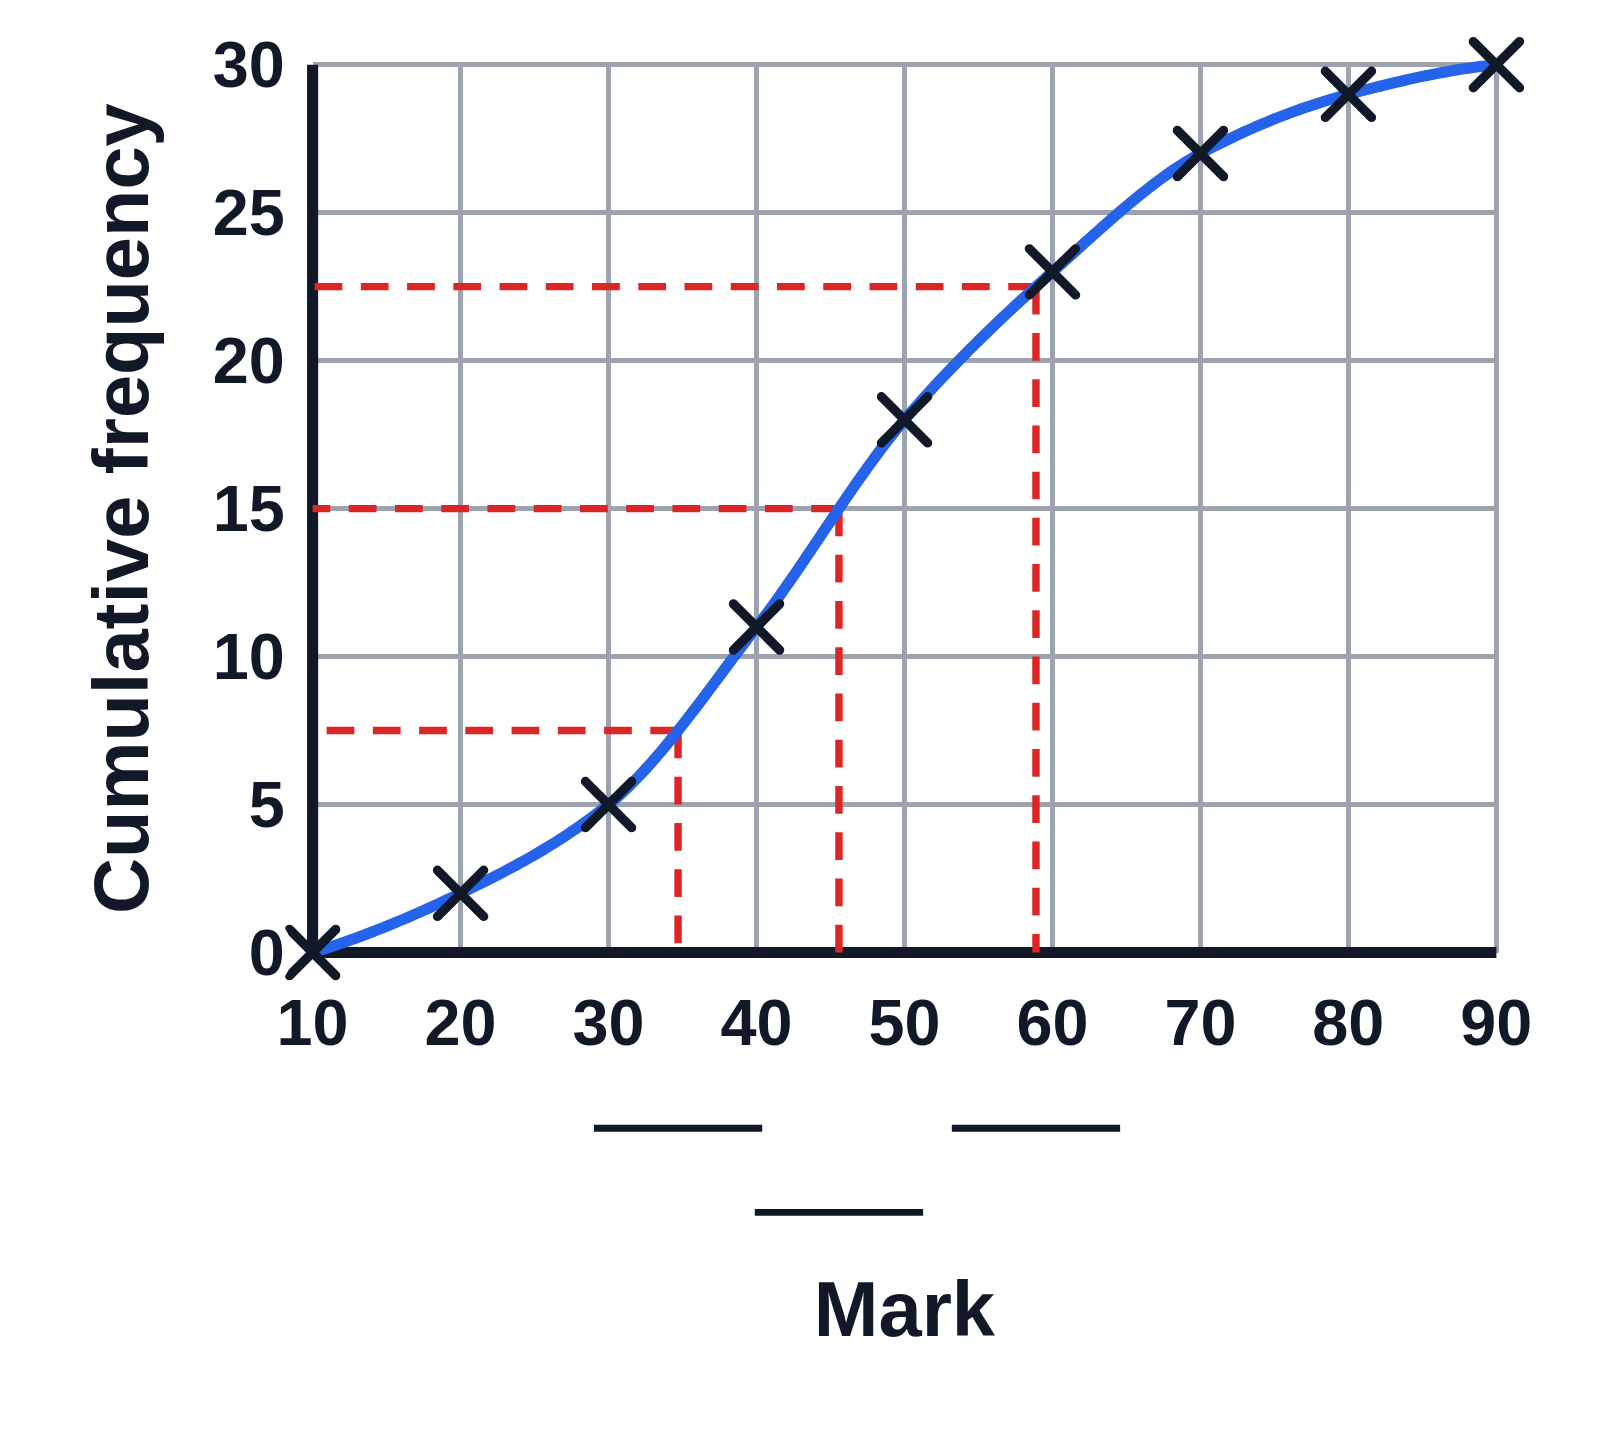
An example figure from the Cumulative Frequency Graph Generator.

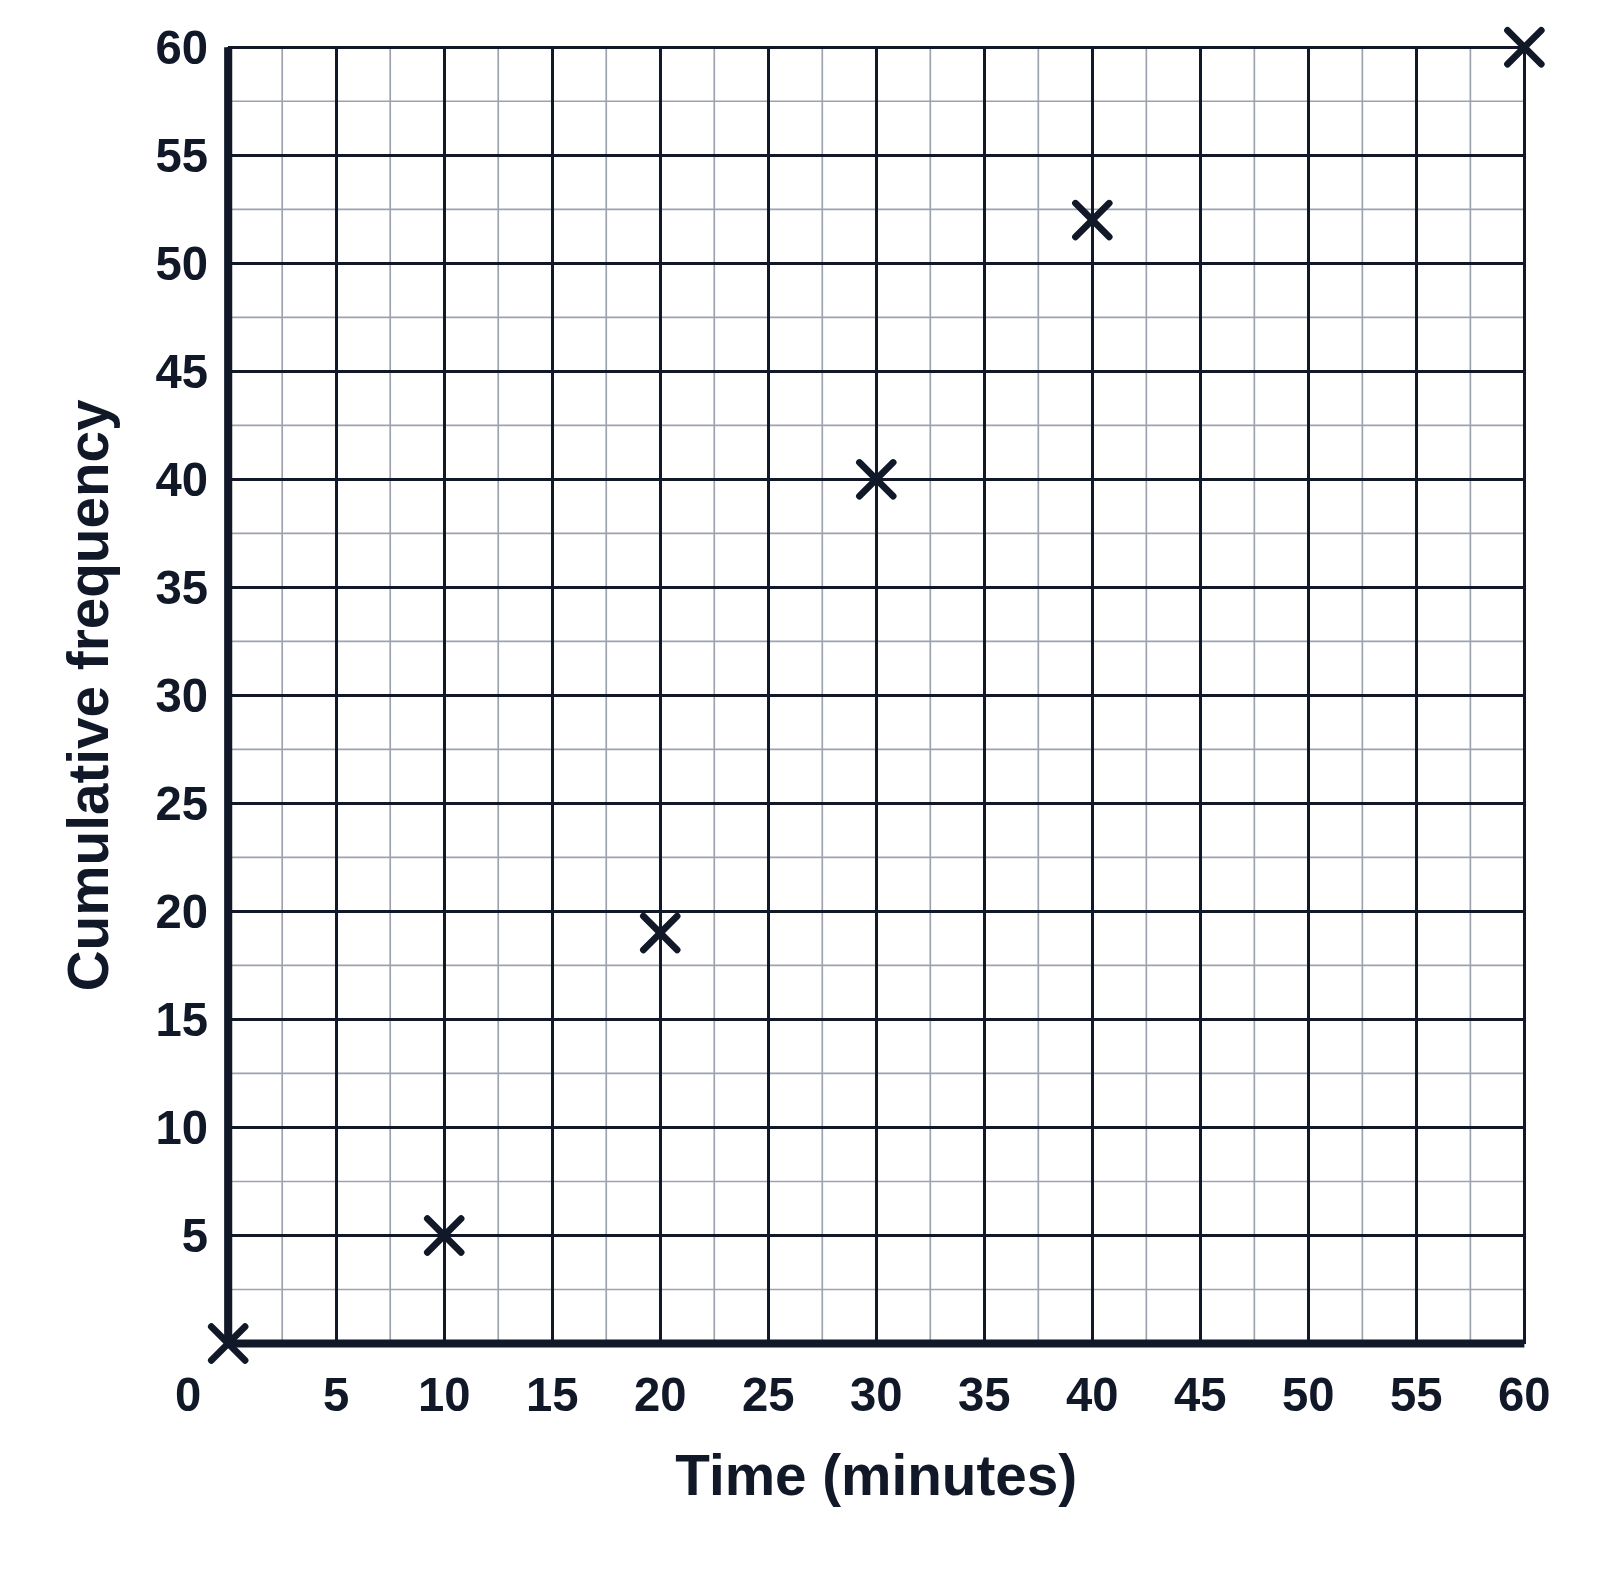
Crosses plotted for a cumulative frequency graph of time in minutes, from 0 to 60 on both axes, with no curve drawn through them
Six crosses on a grid with dark gridlines split into halves: one at 0 minutes with a cumulative frequency of 0, then 5 at 10 minutes, 19 at 20, 40 at 30, 52 at 40 and 60 at 60. The time axis runs from 0 to 60 minutes and the cumulative frequency axis from 0 to 60, both by 5. No curve is drawn, so students join the points with a smooth curve.

Editing opens it in the Cumulative Frequency Graph Generator with these settings, to change anything and copy or download your own.

Free to use in your tests, worksheets, slides or anything else, no credit needed. Public domain under CC0 1.0. How to reuse our figures

More Cumulative Frequency Graph examples