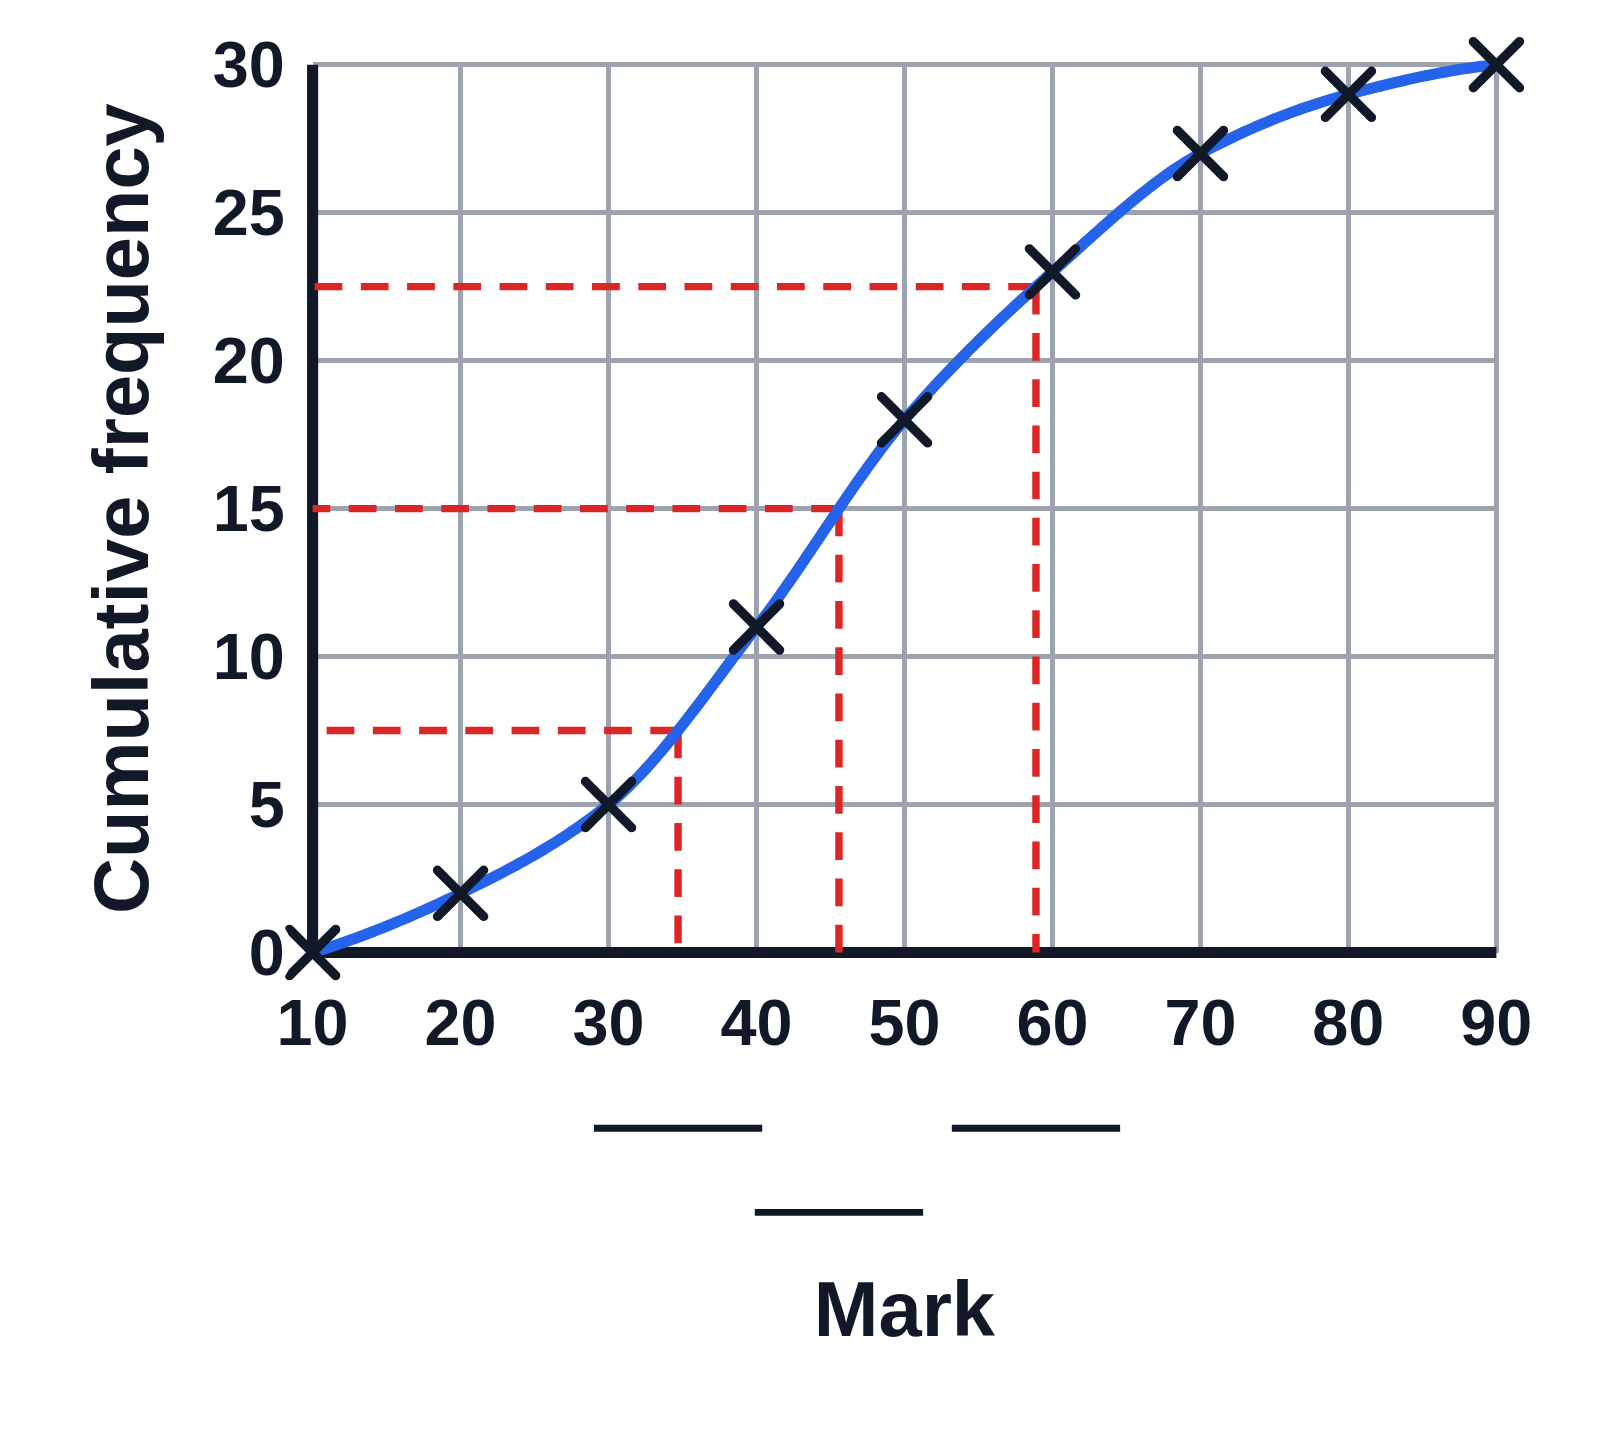
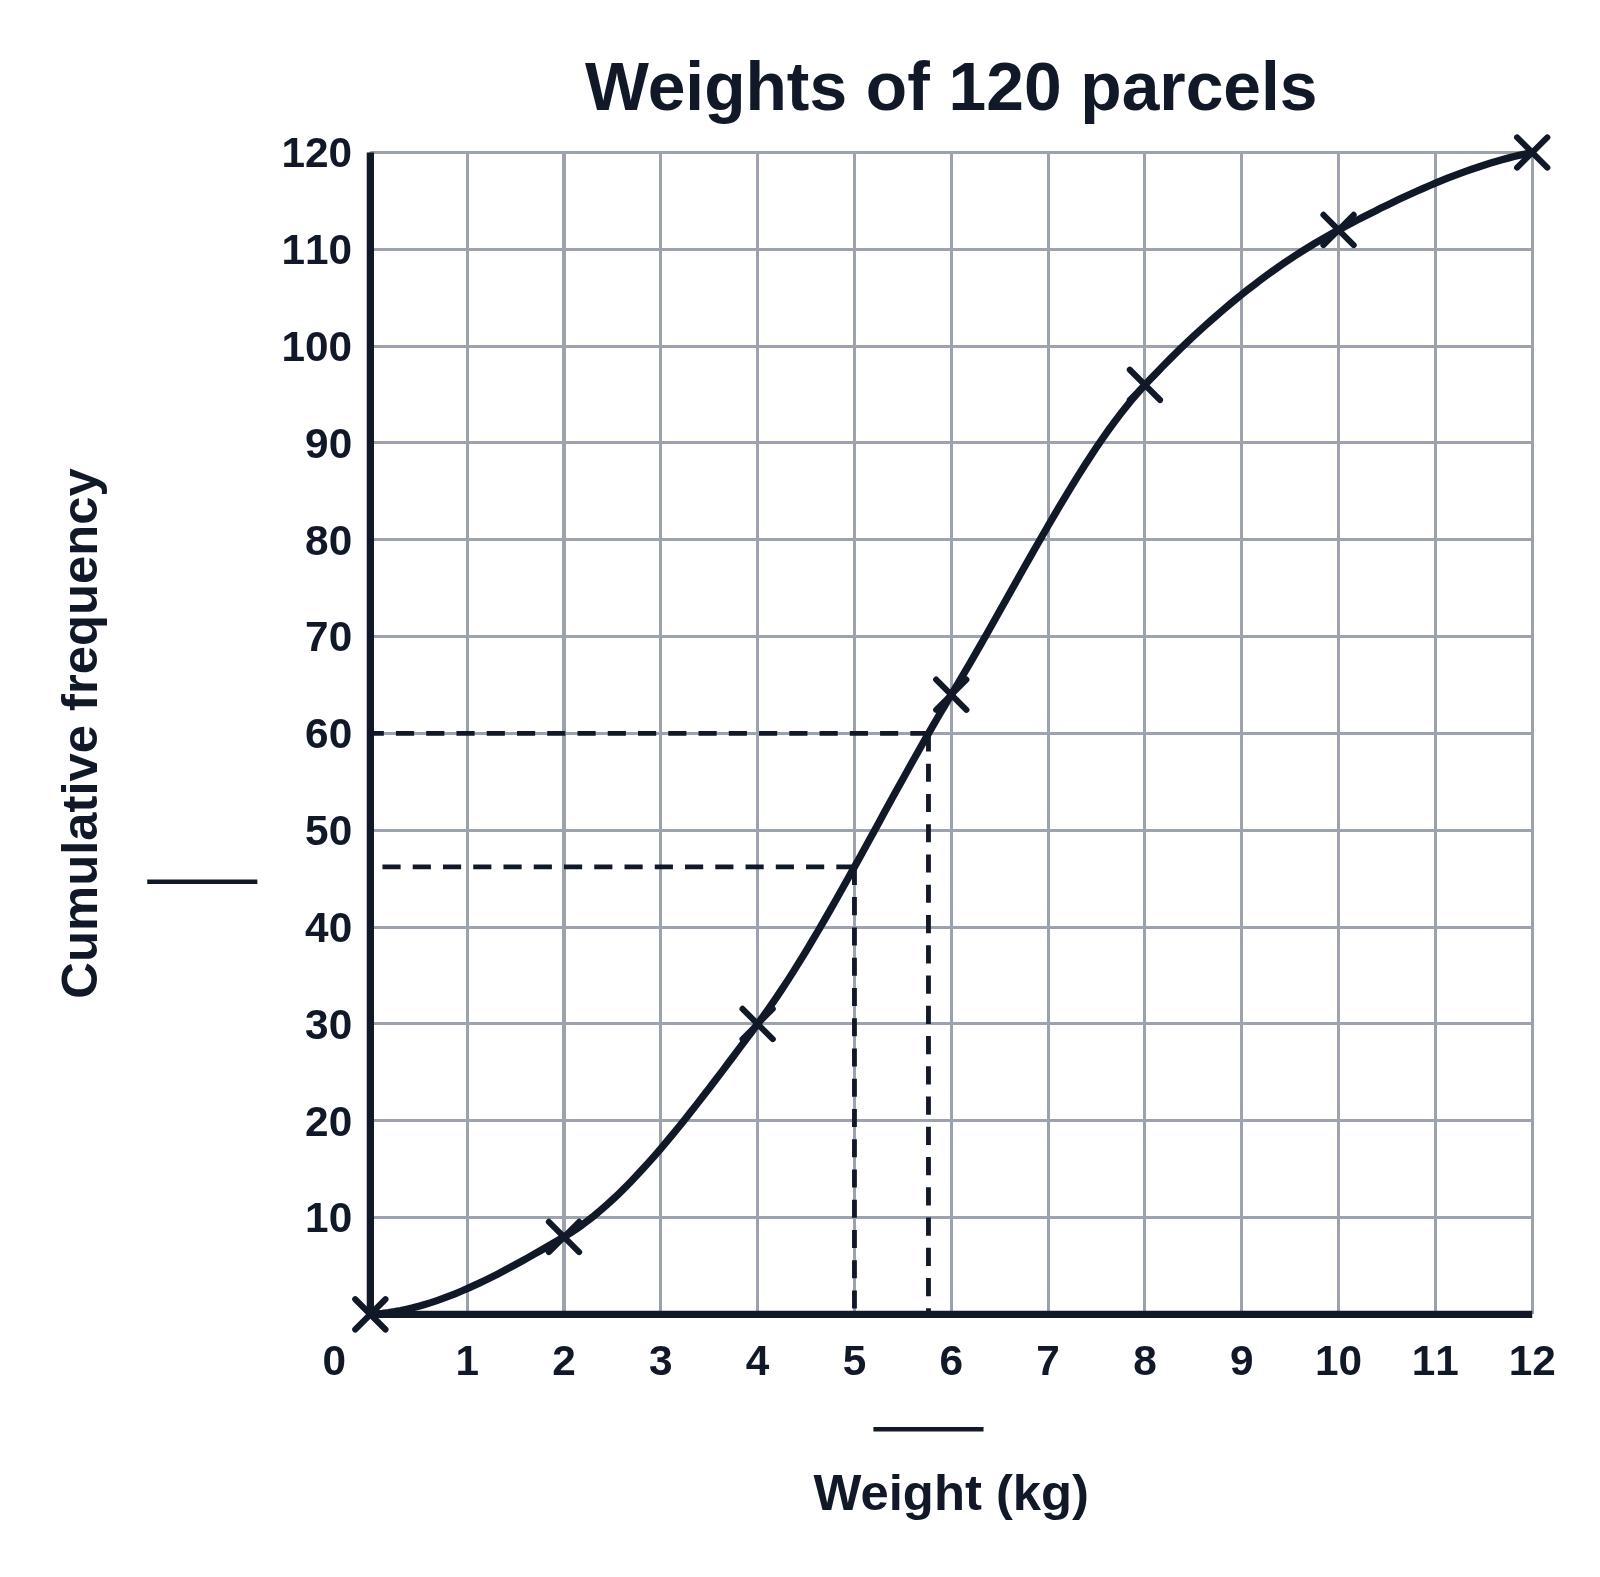
A cumulative frequency curve of 30 test marks, sorted into bins of 10 from 10 to 90, with crosses at each upper bound joined by a smooth blue curve. The mark axis runs from 10 to 90 by 10 and the cumulative frequency axis from 0 to 30 by 5. Dashed red lines go across from 7.5, 15 and 22.5 to the curve and down, each to a blank line under the axis for students to write the lower quartile, median and upper quartile.