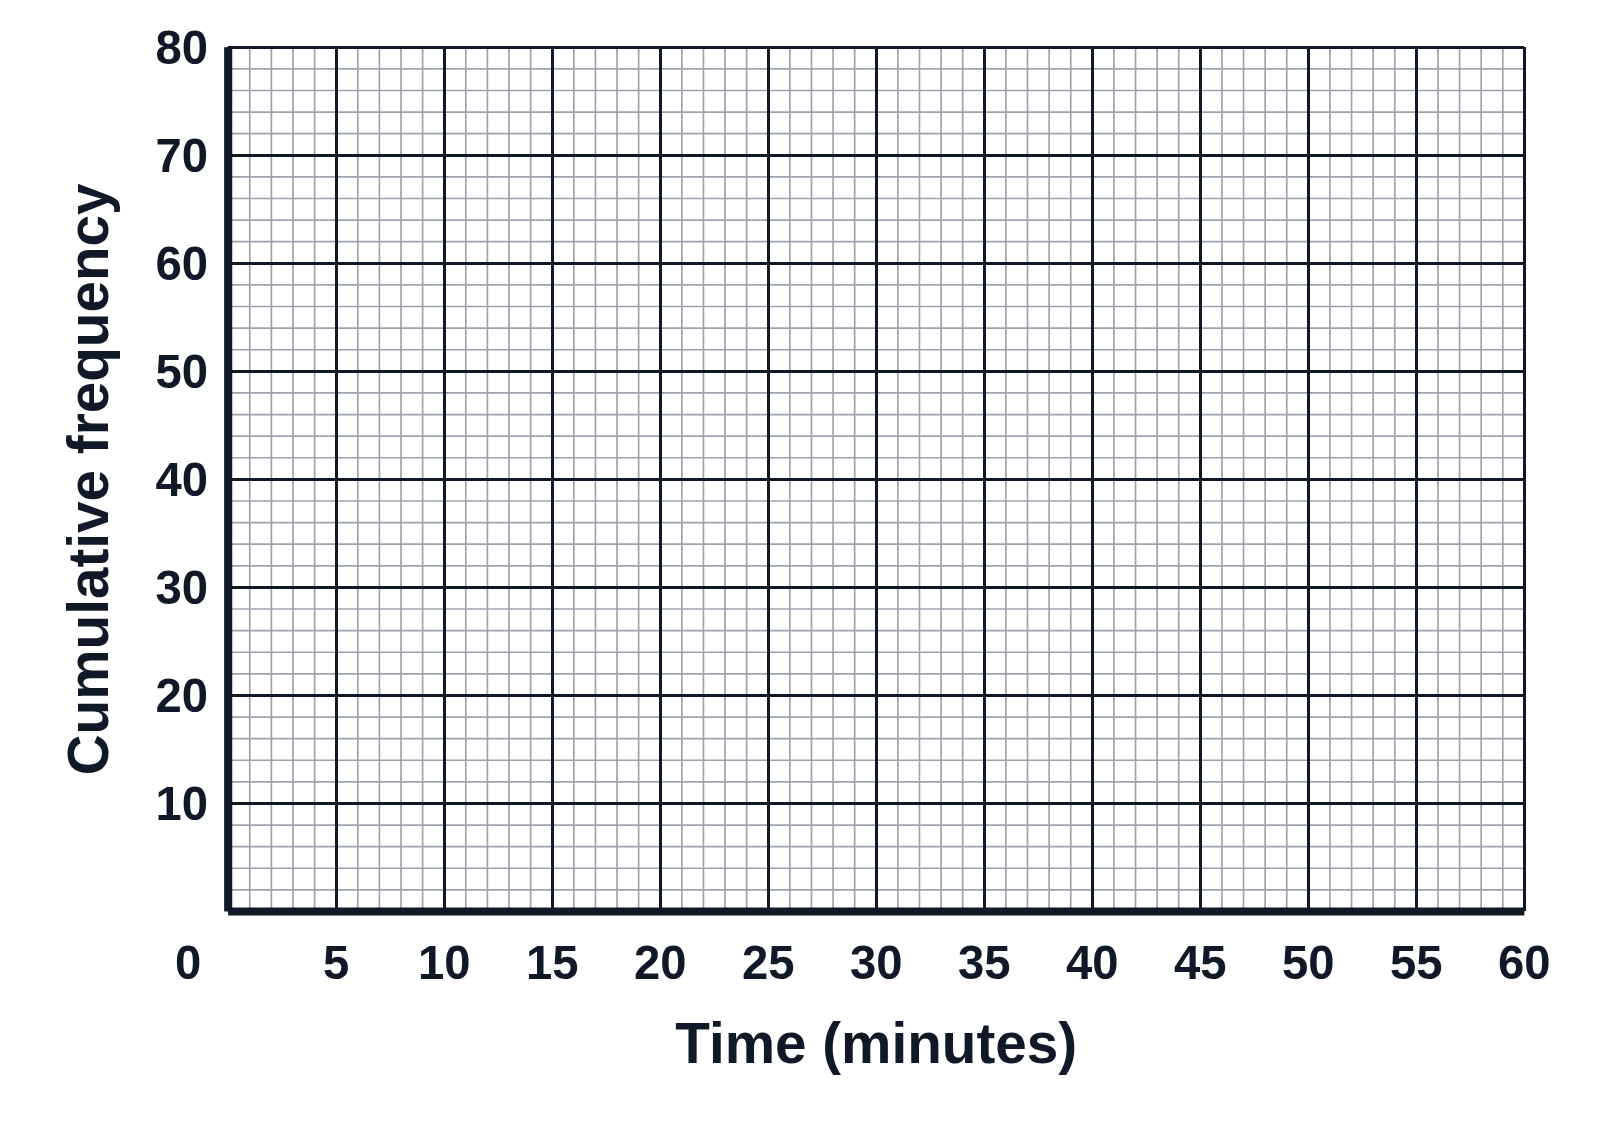
A blank grid for a cumulative frequency graph, with dark gridlines each split into five smaller squares like graph paper. The horizontal axis is titled Time (minutes) and numbered from 0 to 60 by 5, and the vertical axis is titled Cumulative frequency and numbered from 0 to 80 by 10. Nothing is plotted, so students plot the points from a table and draw the curve.