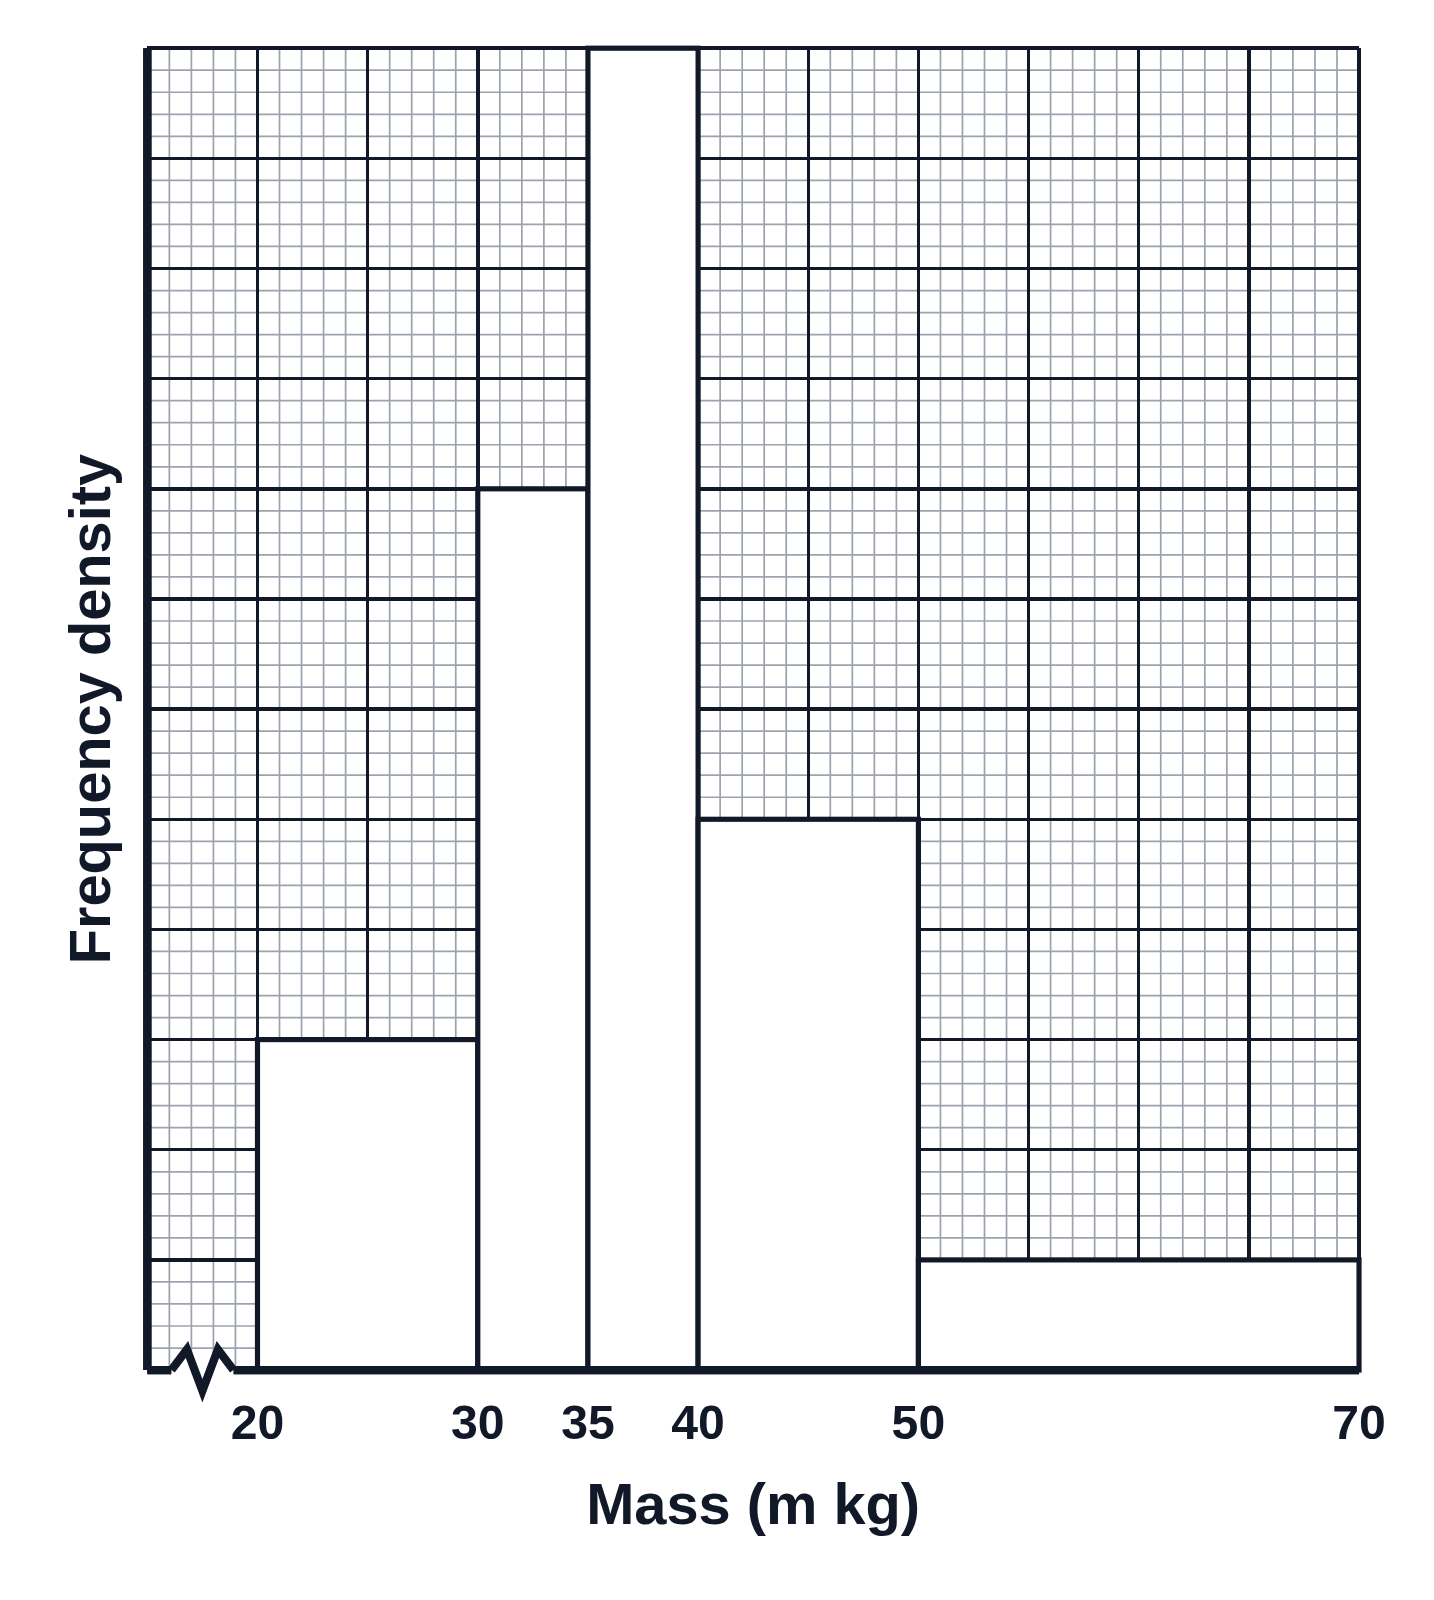
A histogram of masses with five white bars of unequal width for 20 < m ≤ 30, 30 < m ≤ 35, 35 < m ≤ 40, 40 < m ≤ 50 and 50 < m ≤ 70 kg. The vertical axis is titled Frequency density but has no numbers, only gridlines, with each block split into fifths by minor ones, so students work out its scale from one bar’s frequency. The horizontal axis is titled Mass (m kg), with a zig-zag break before 20.