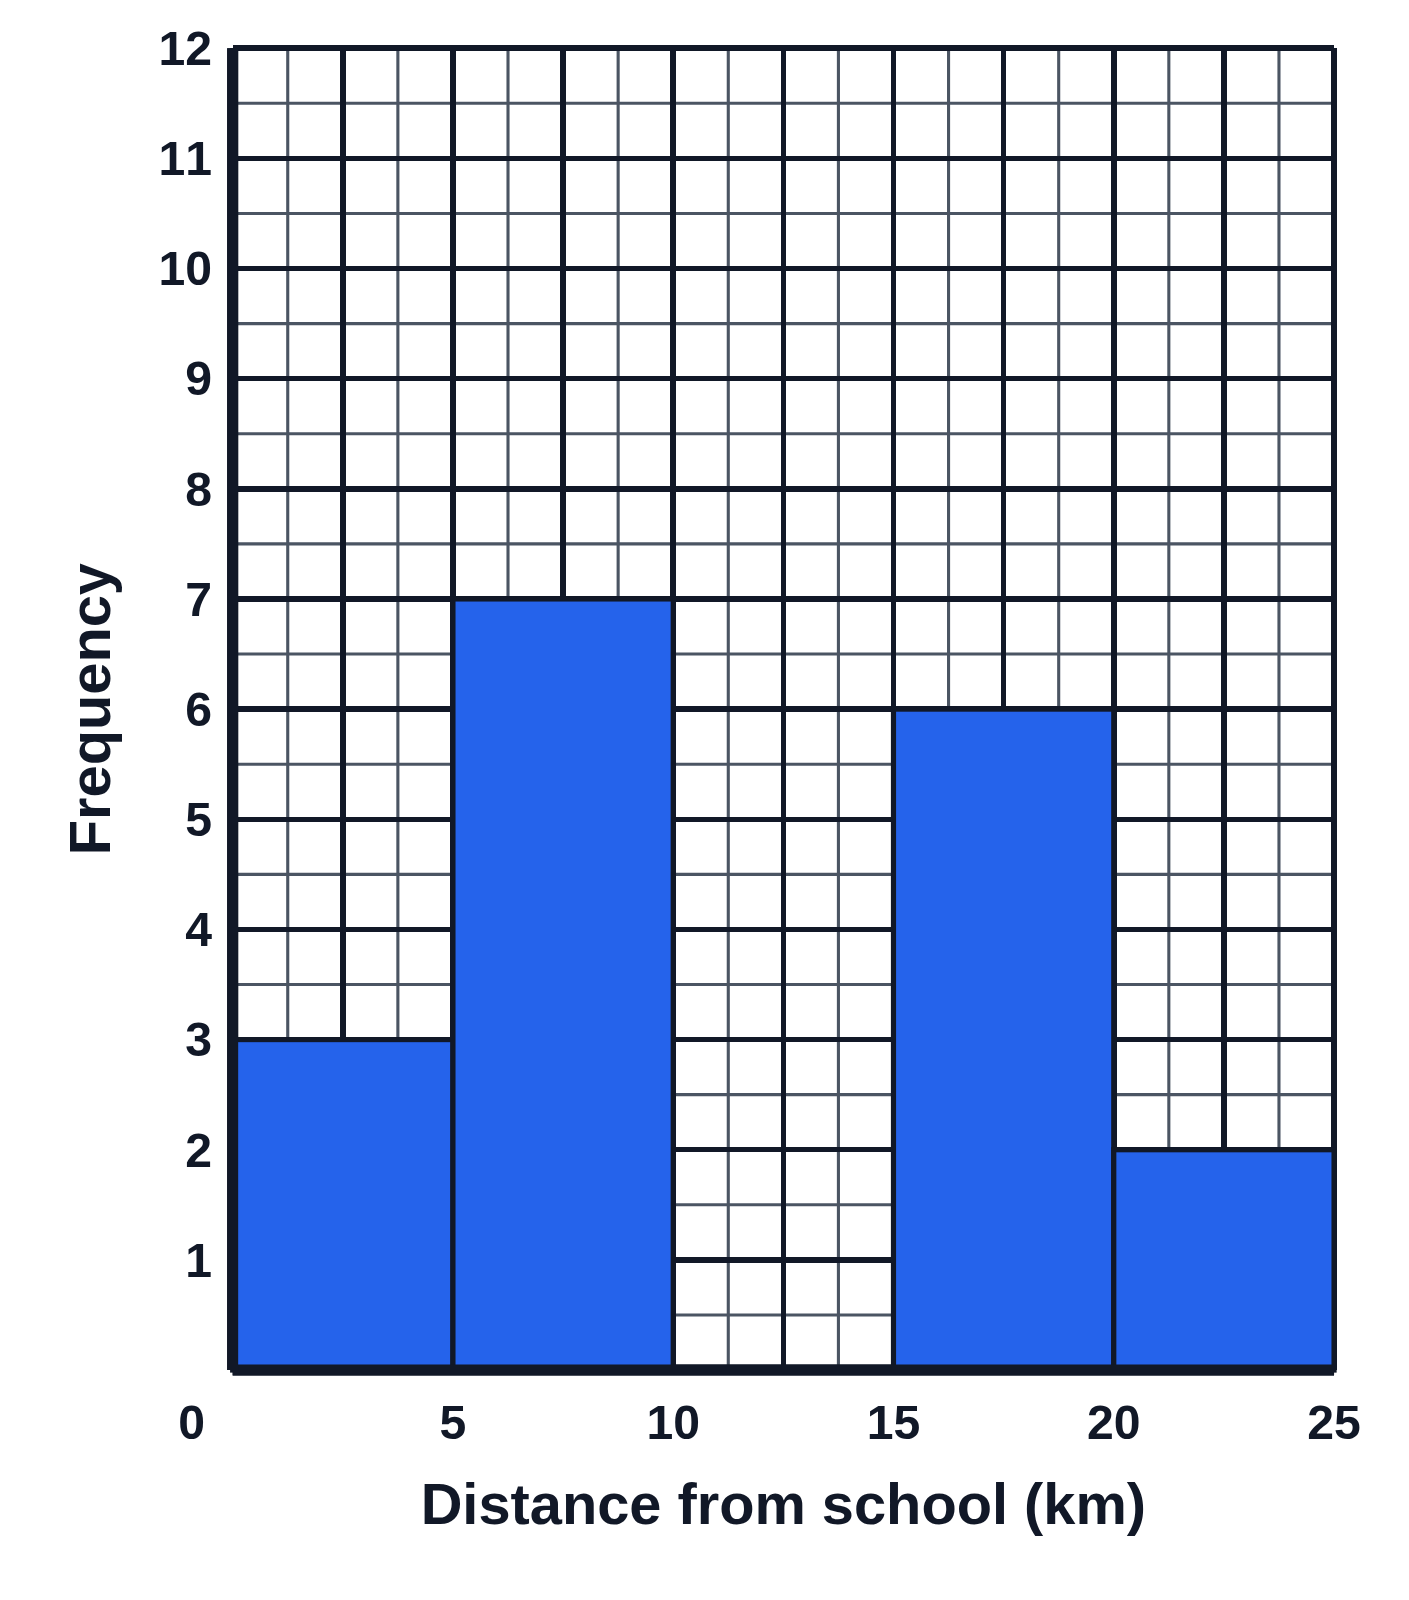
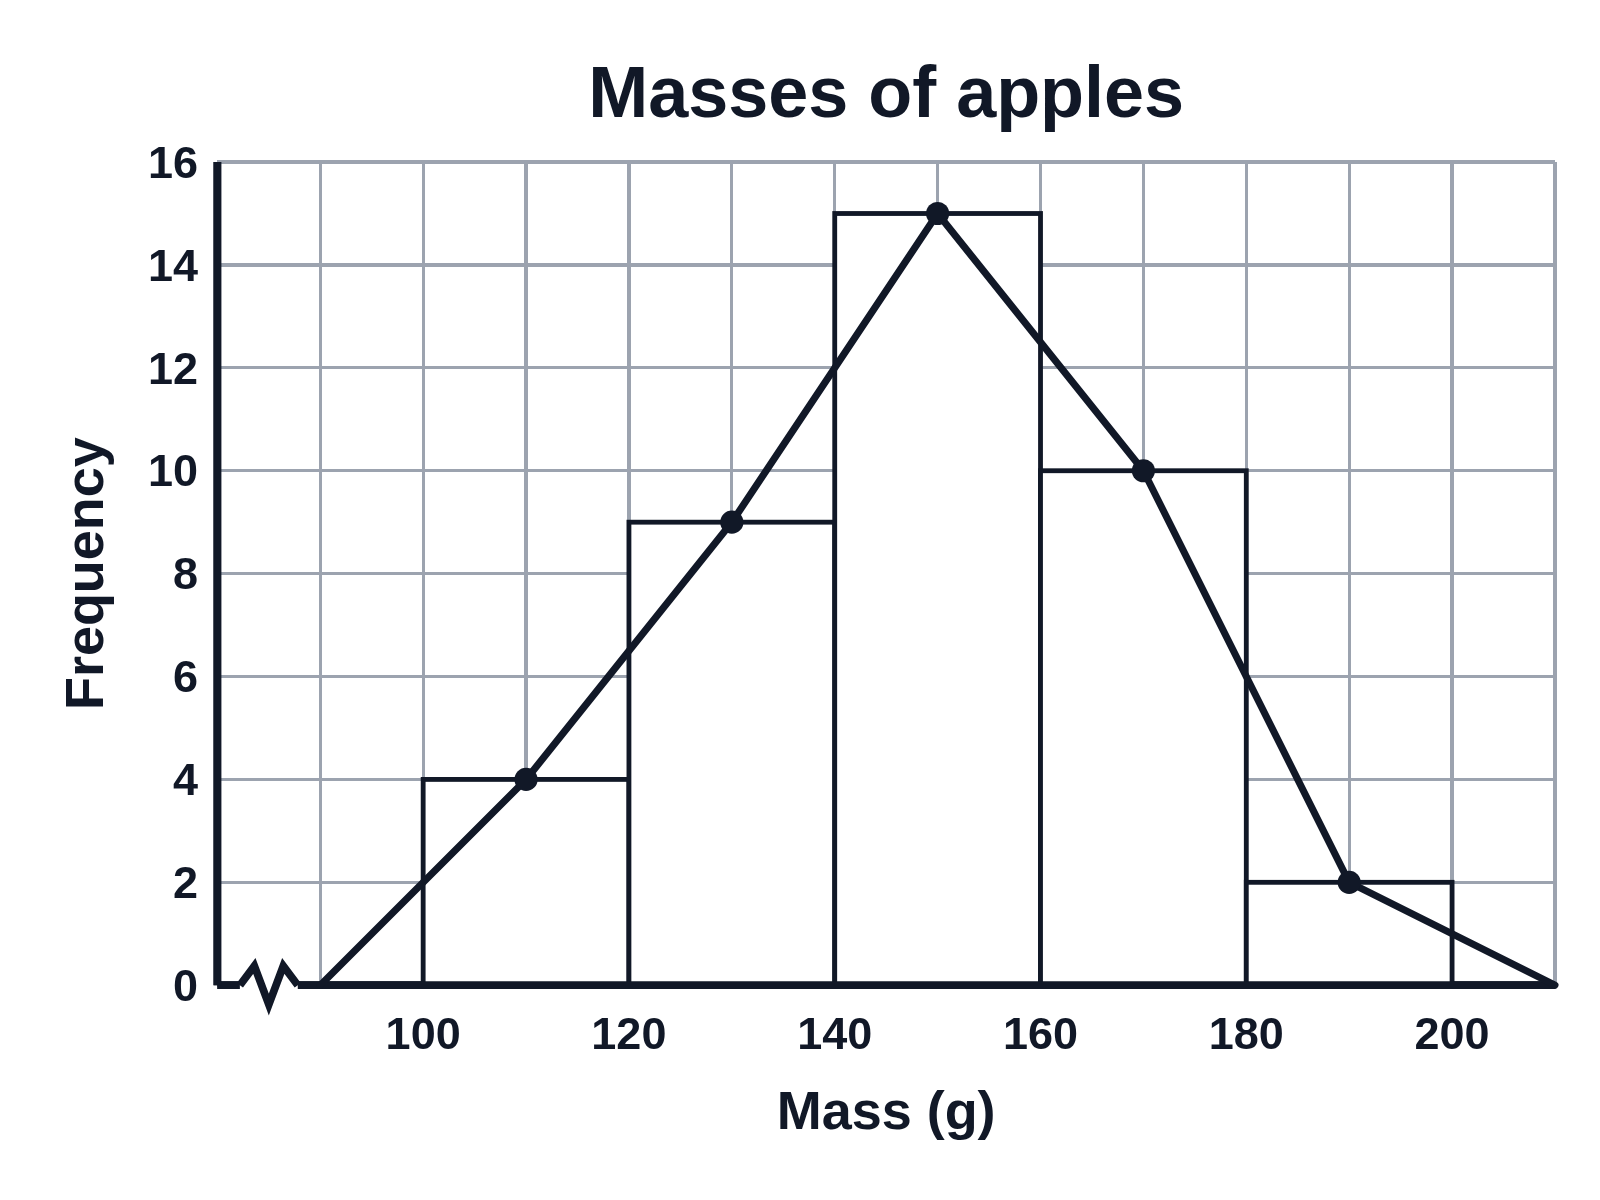
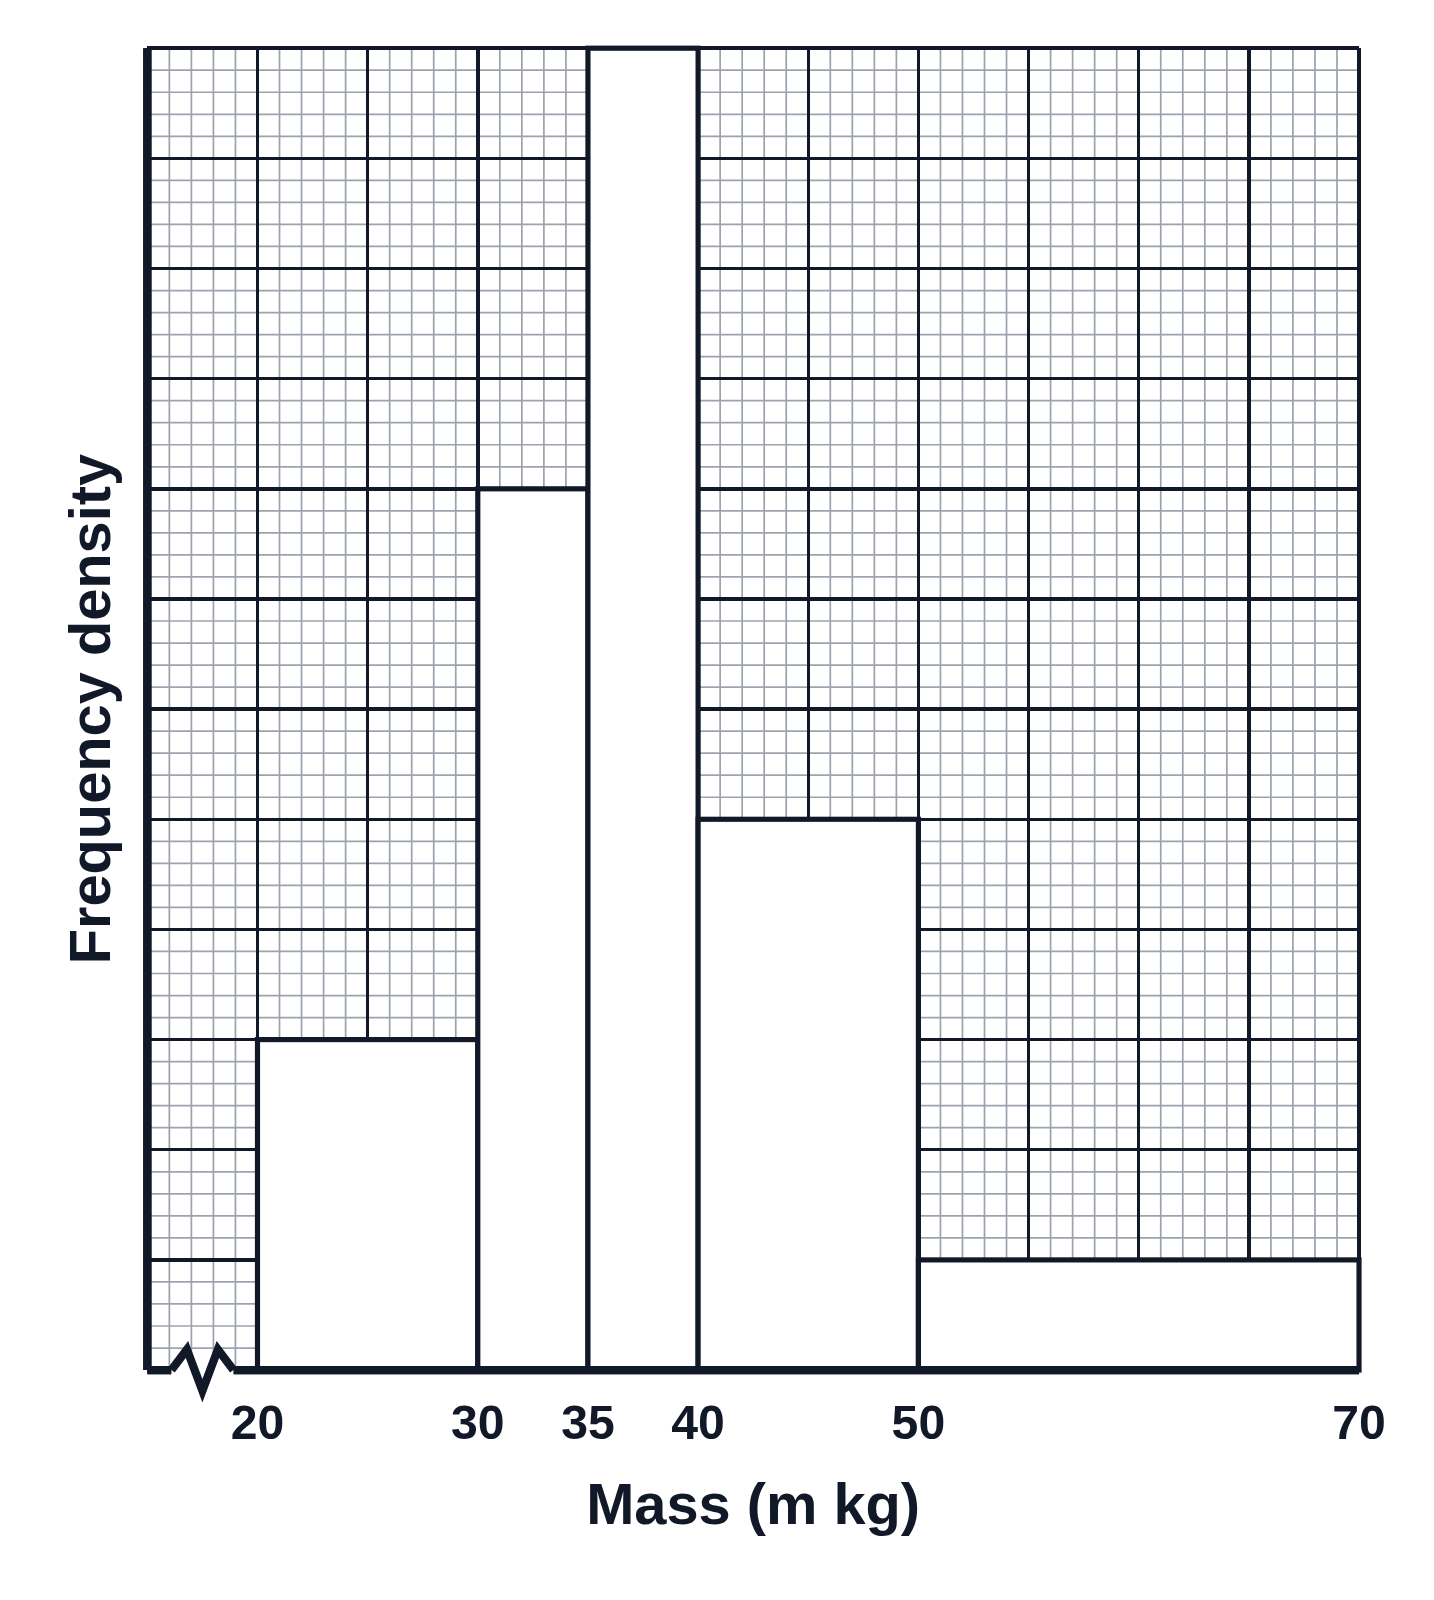
A histogram of how far students live from school, with bars for the bins 0–5, 5–10, 15–20 and 20–25 km and no bar for 10–15 km, so students draw it from a frequency table. The vertical axis is titled Frequency and numbered from 0 to 12, on bold gridlines split into halves, and the horizontal axis is titled Distance from school (km).