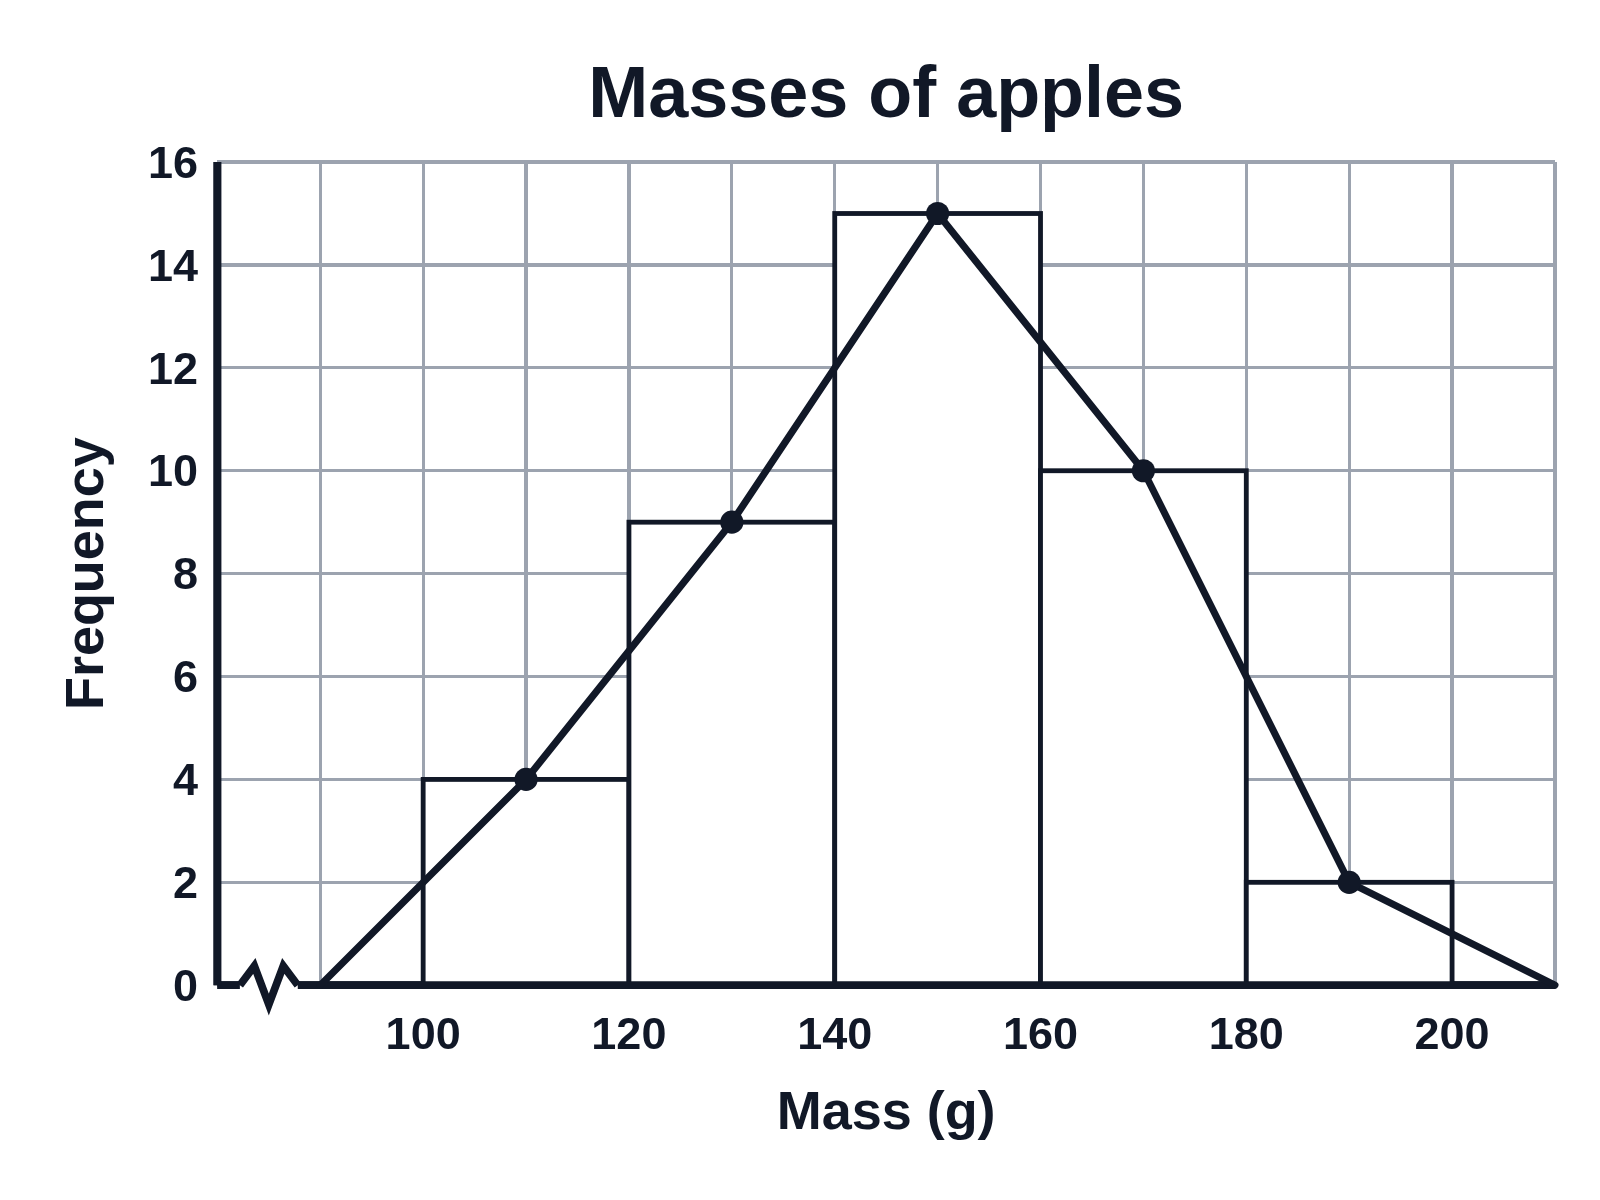
Histogram with a frequency polygon

An example figure from the Histogram Generator.

A histogram of the masses of apples with white bars from 100 to 200 g and a frequency polygon joining the middle of each bar’s top, closed down to the axis at each end
A histogram titled Masses of apples, with five white bars for bins of 20 g from 100 to 200 g, and a frequency polygon drawn over them through the middle of the top of each bar. The polygon is closed down to the horizontal axis half a bin past each end, at 90 and 210 g. The vertical axis is titled Frequency and numbered from 0 to 16 by 2, and the horizontal axis, titled Mass (g), has a zig-zag break before 100.

Editing opens it in the Histogram Generator with these settings, to change anything and copy or download your own.

Free to use in your tests, worksheets, slides or anything else, no credit needed. Public domain under CC0 1.0. How to reuse our figures

More Histogram examples