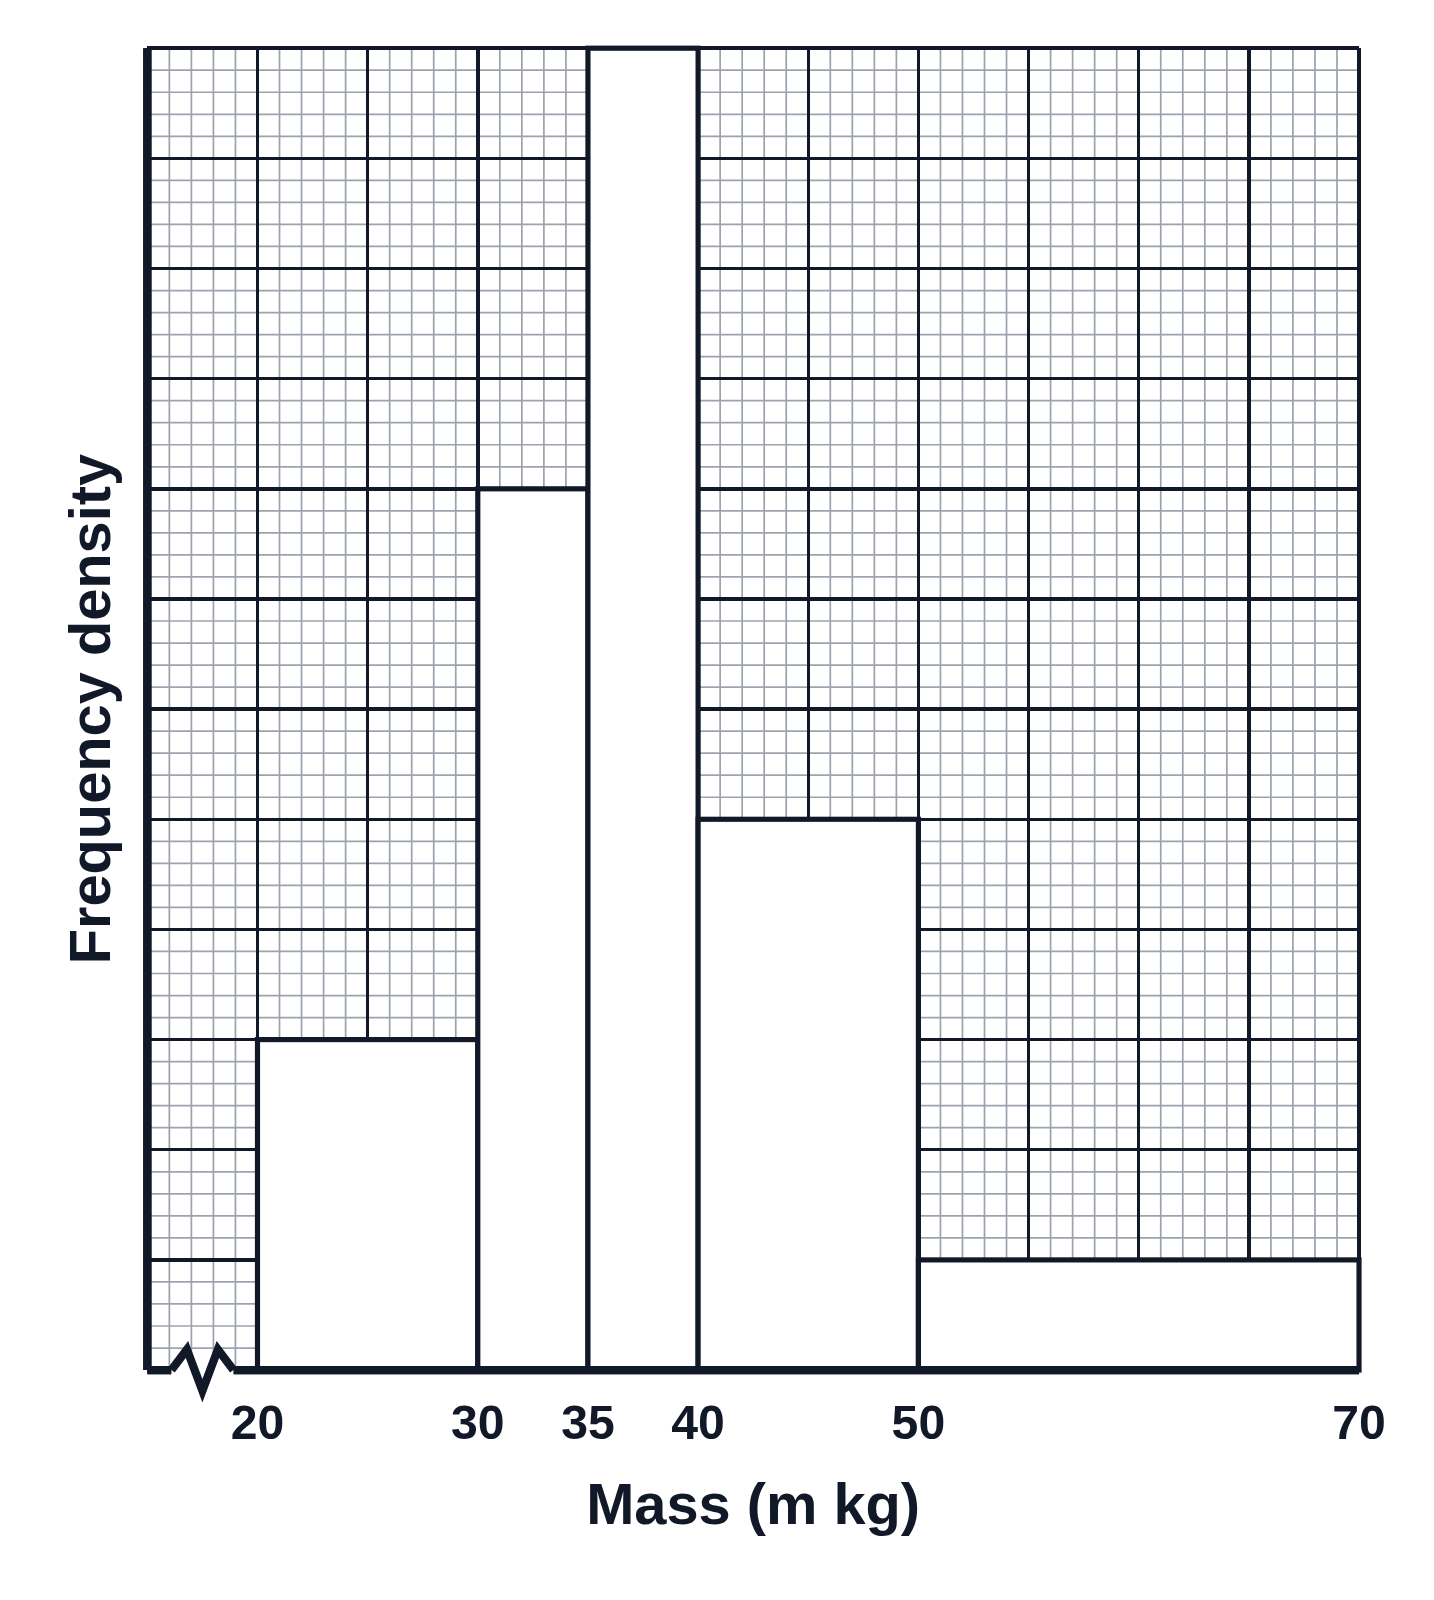
Frequency density histogram with unequal class widths

An example figure from the Histogram Generator.

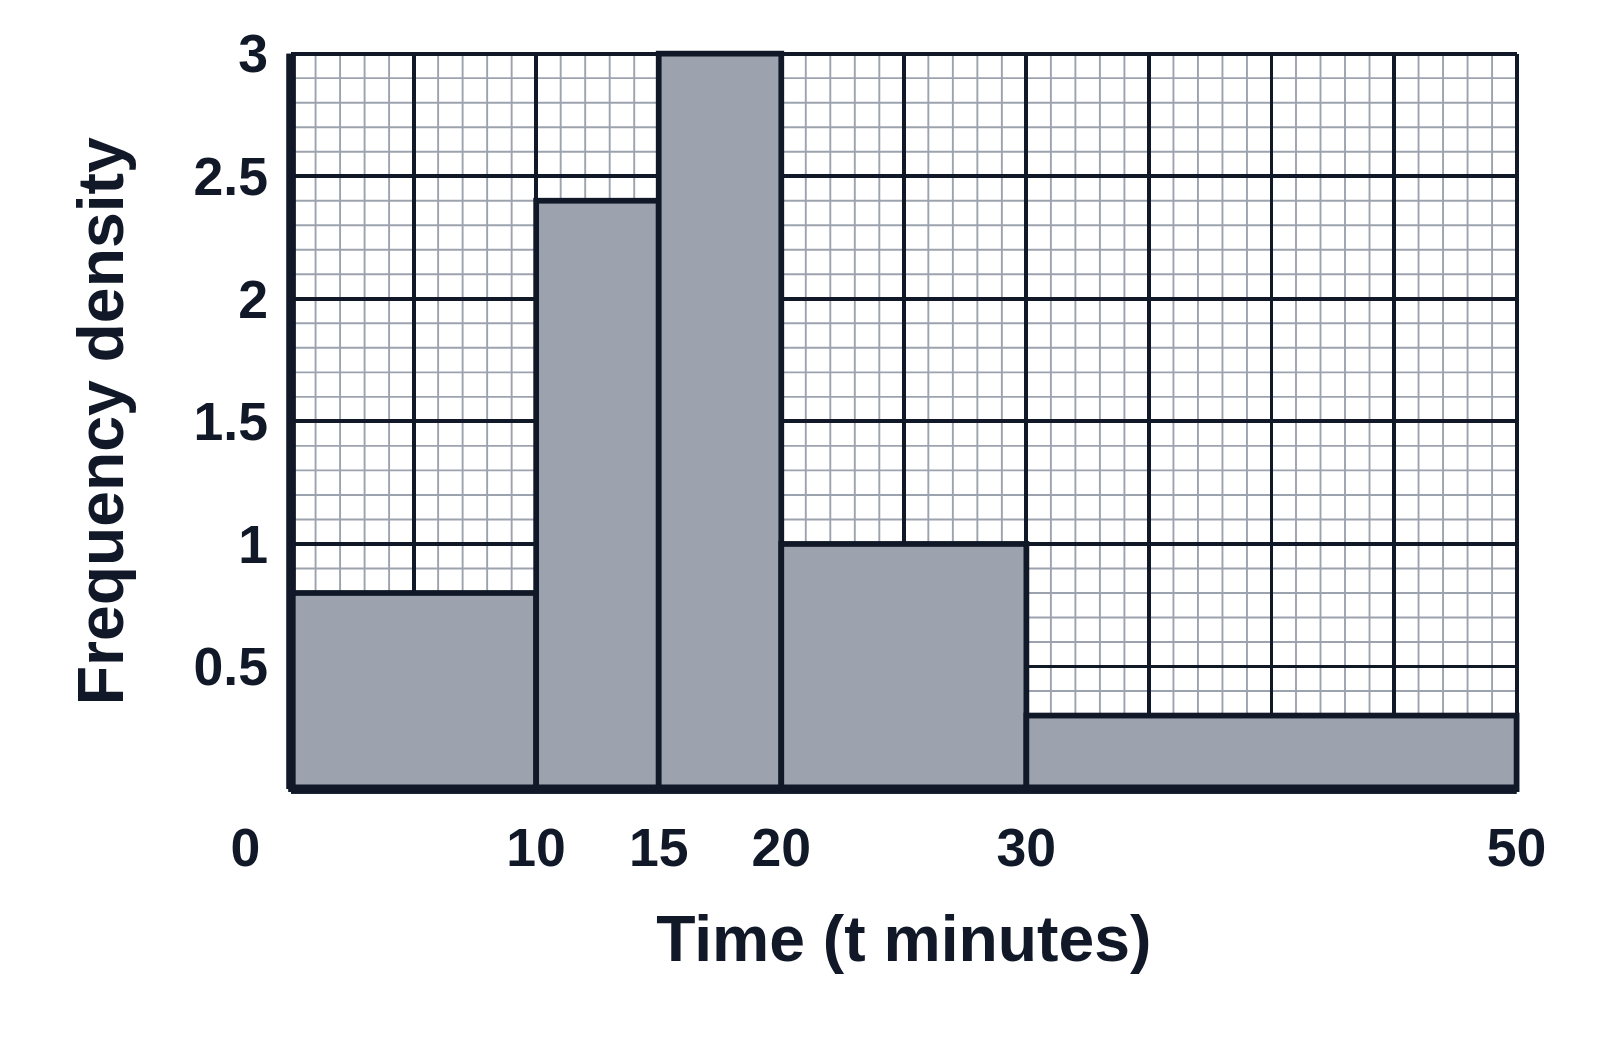
A gray histogram on graph paper with five bars of different widths for times from 0 to 50 minutes, over a frequency density axis from 0 to 3
A GCSE-style histogram with unequal class widths: five gray bars for 0 < t ≤ 10, 10 < t ≤ 15, 15 < t ≤ 20, 20 < t ≤ 30 and 30 < t ≤ 50, so each bar’s area stands for its frequency. The vertical axis is titled Frequency density and numbered from 0 to 3 by 0.5, with each block split into fifths by minor gridlines, and the horizontal axis is titled Time (t minutes) and numbered at the bin edges 0, 10, 15, 20, 30 and 50.

Editing opens it in the Histogram Generator with these settings, to change anything and copy or download your own.

Free to use in your tests, worksheets, slides or anything else, no credit needed. Public domain under CC0 1.0. How to reuse our figures

More Histogram examples