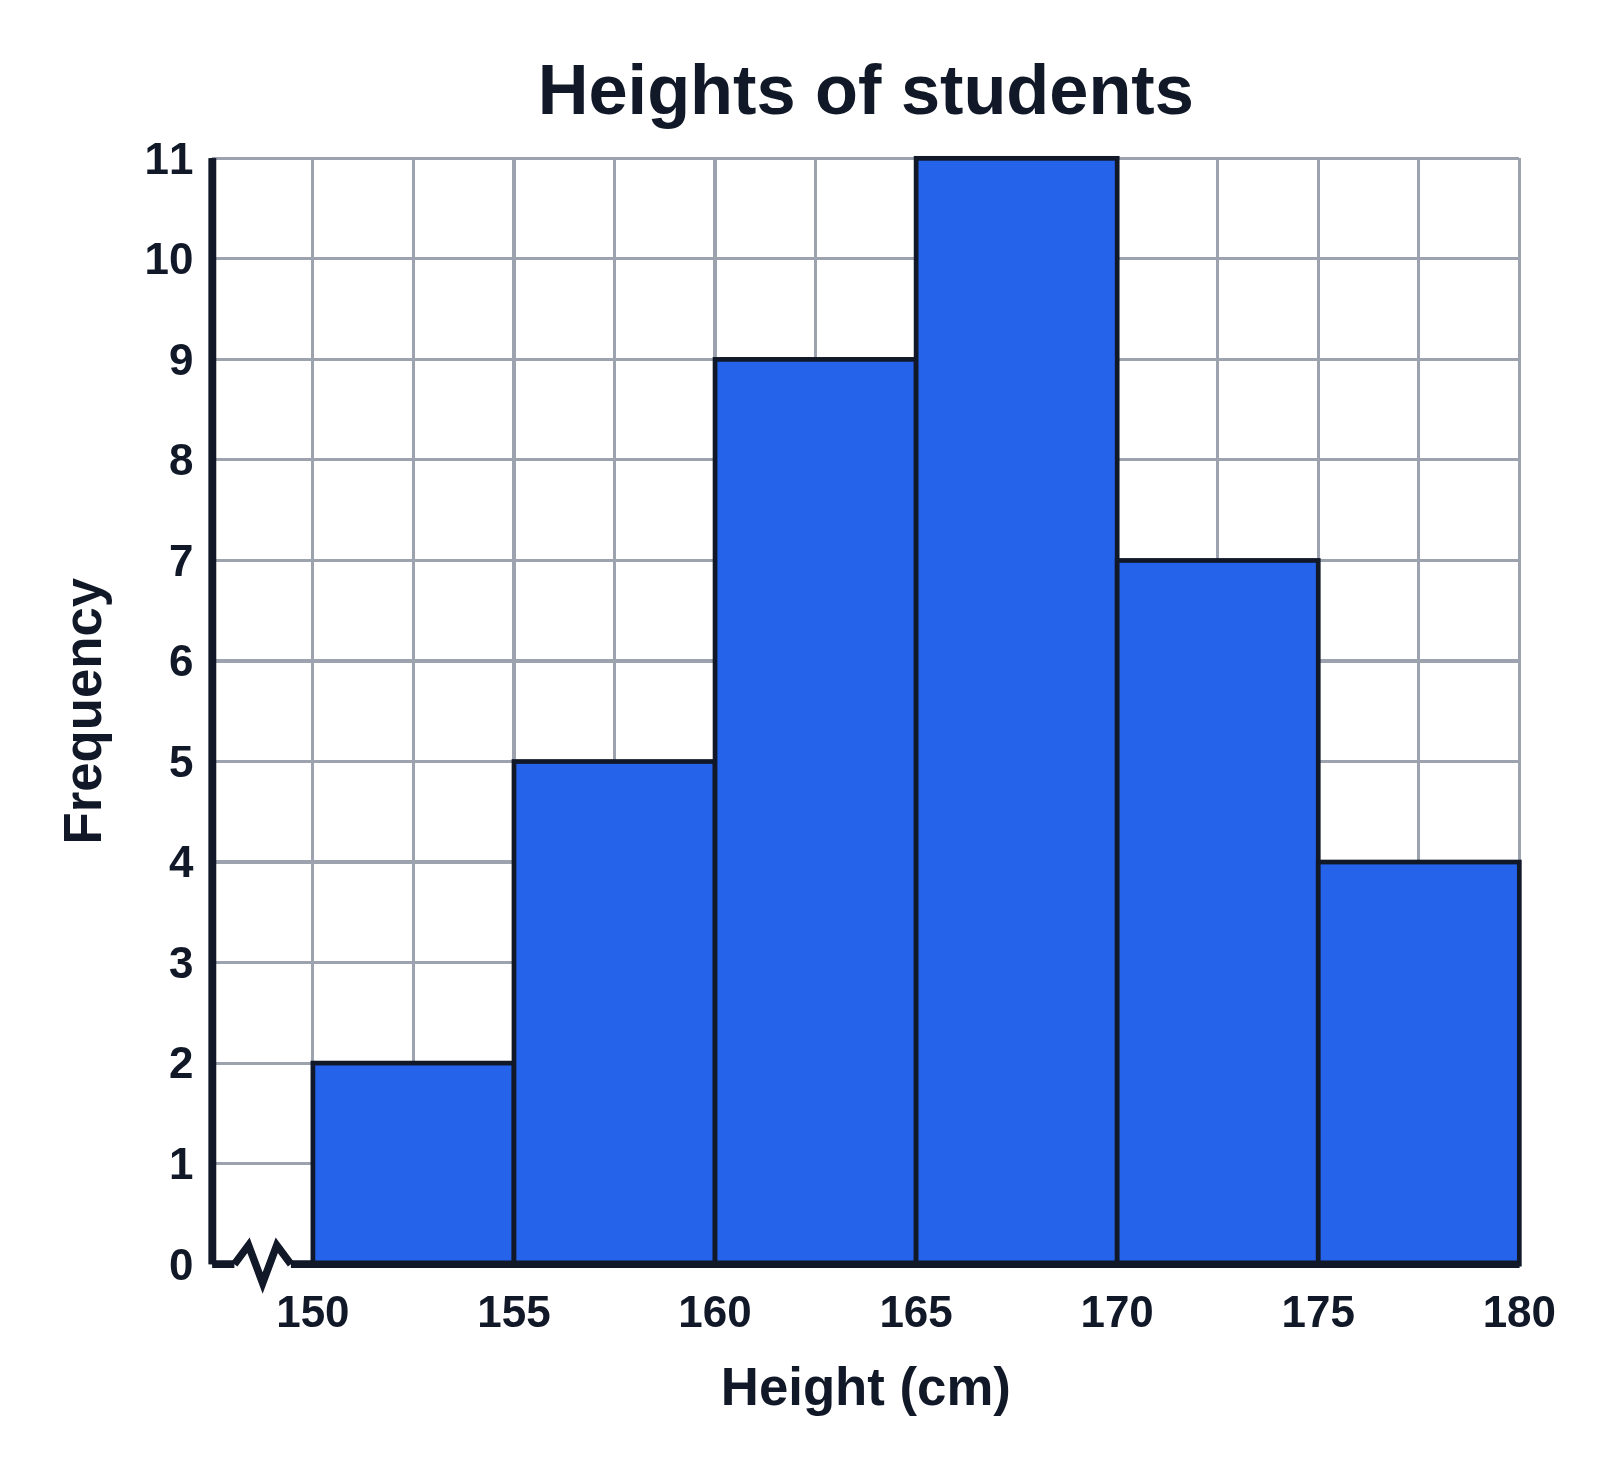
Histogram of student heights

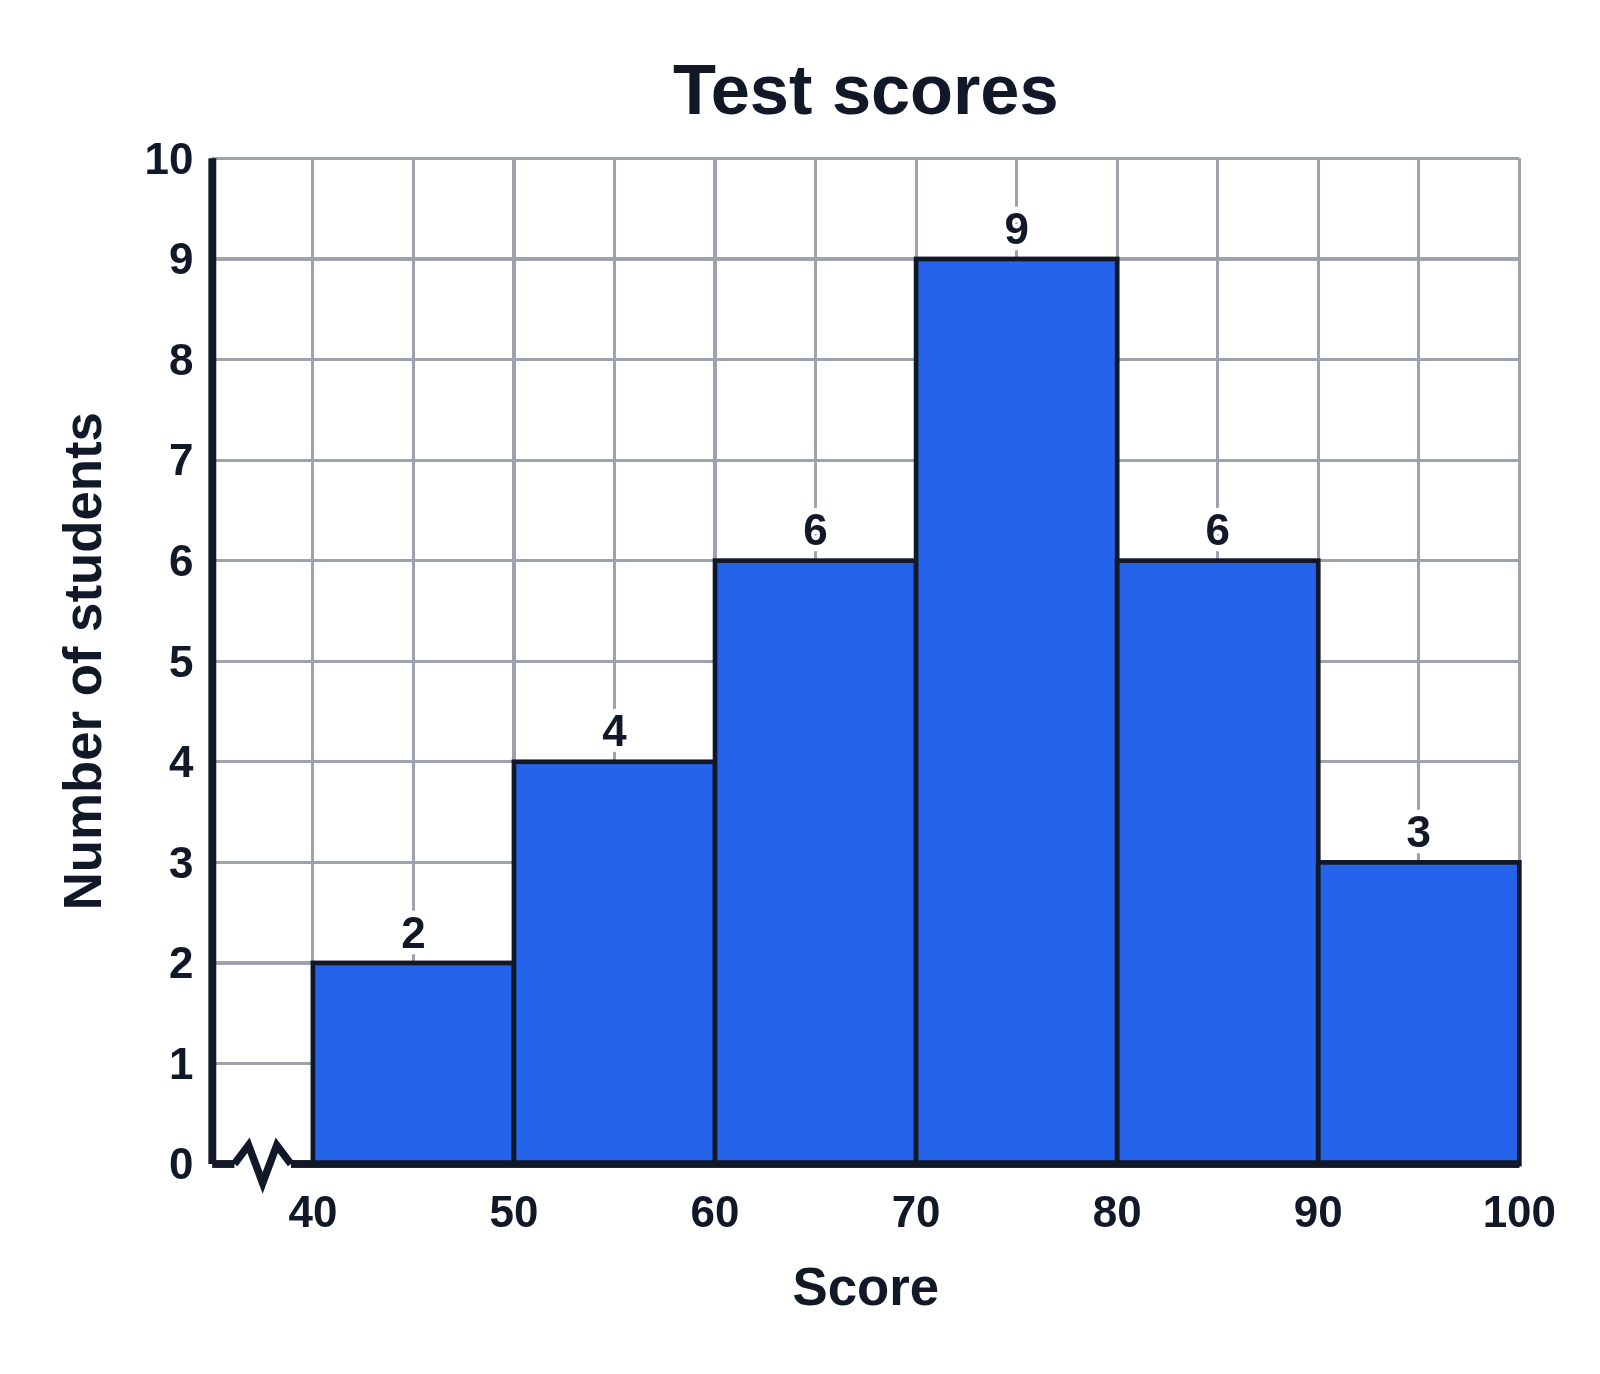
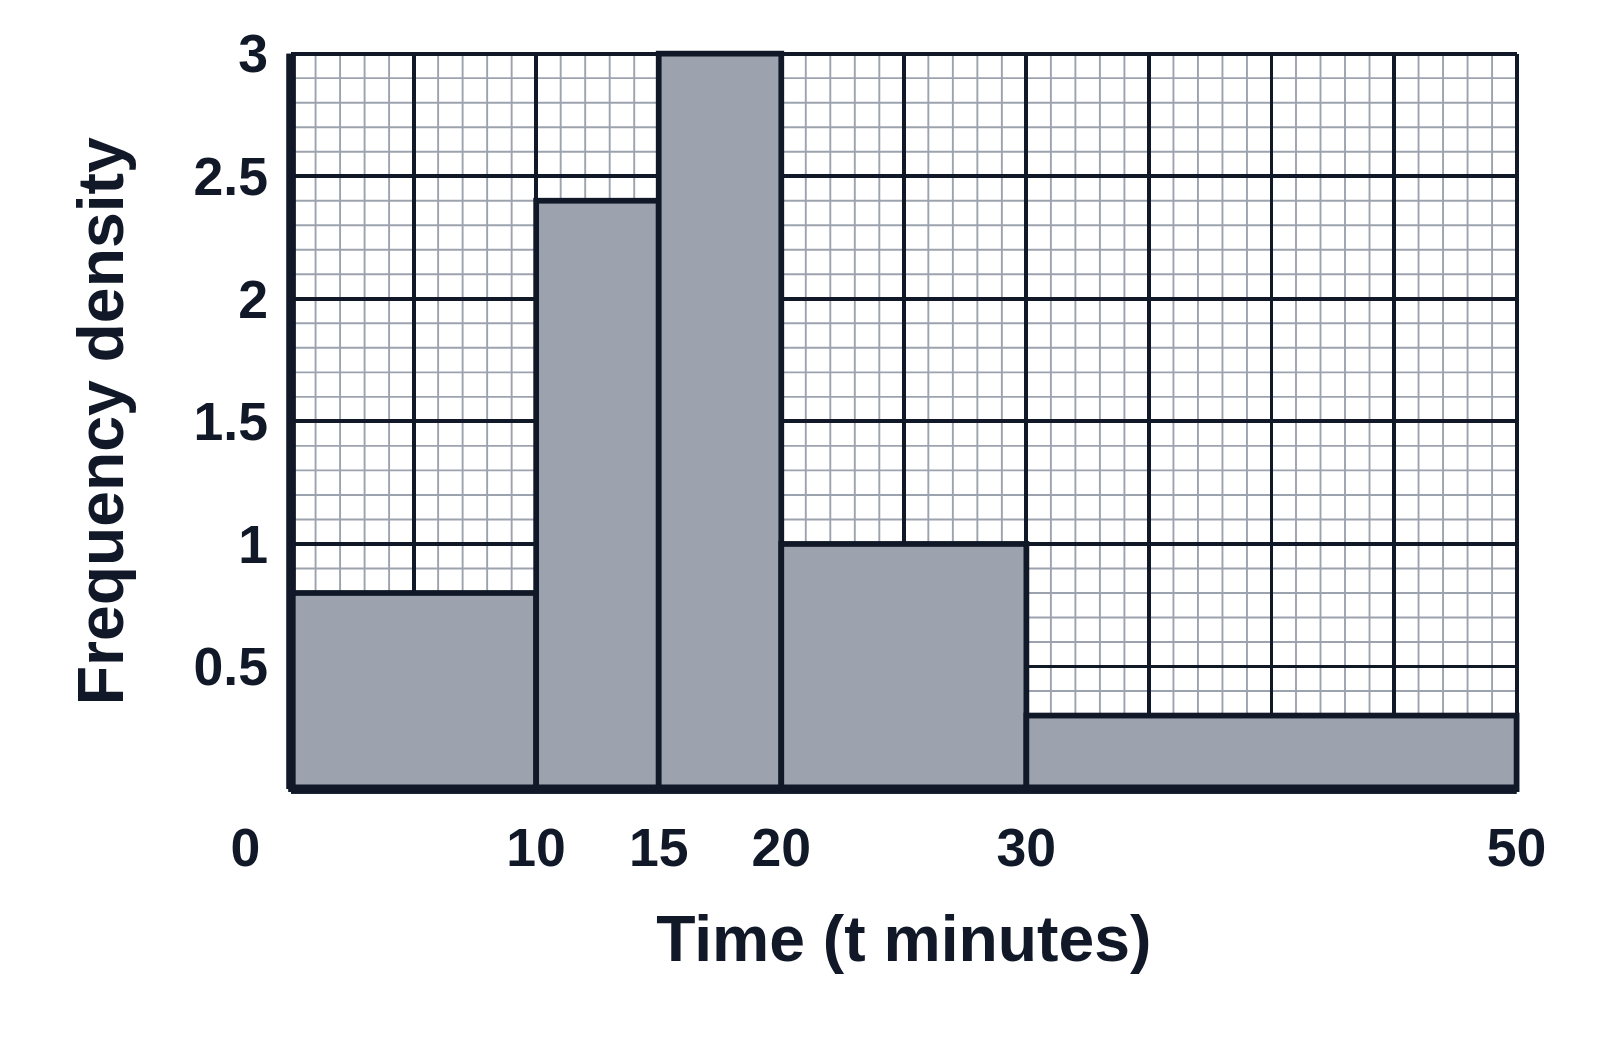
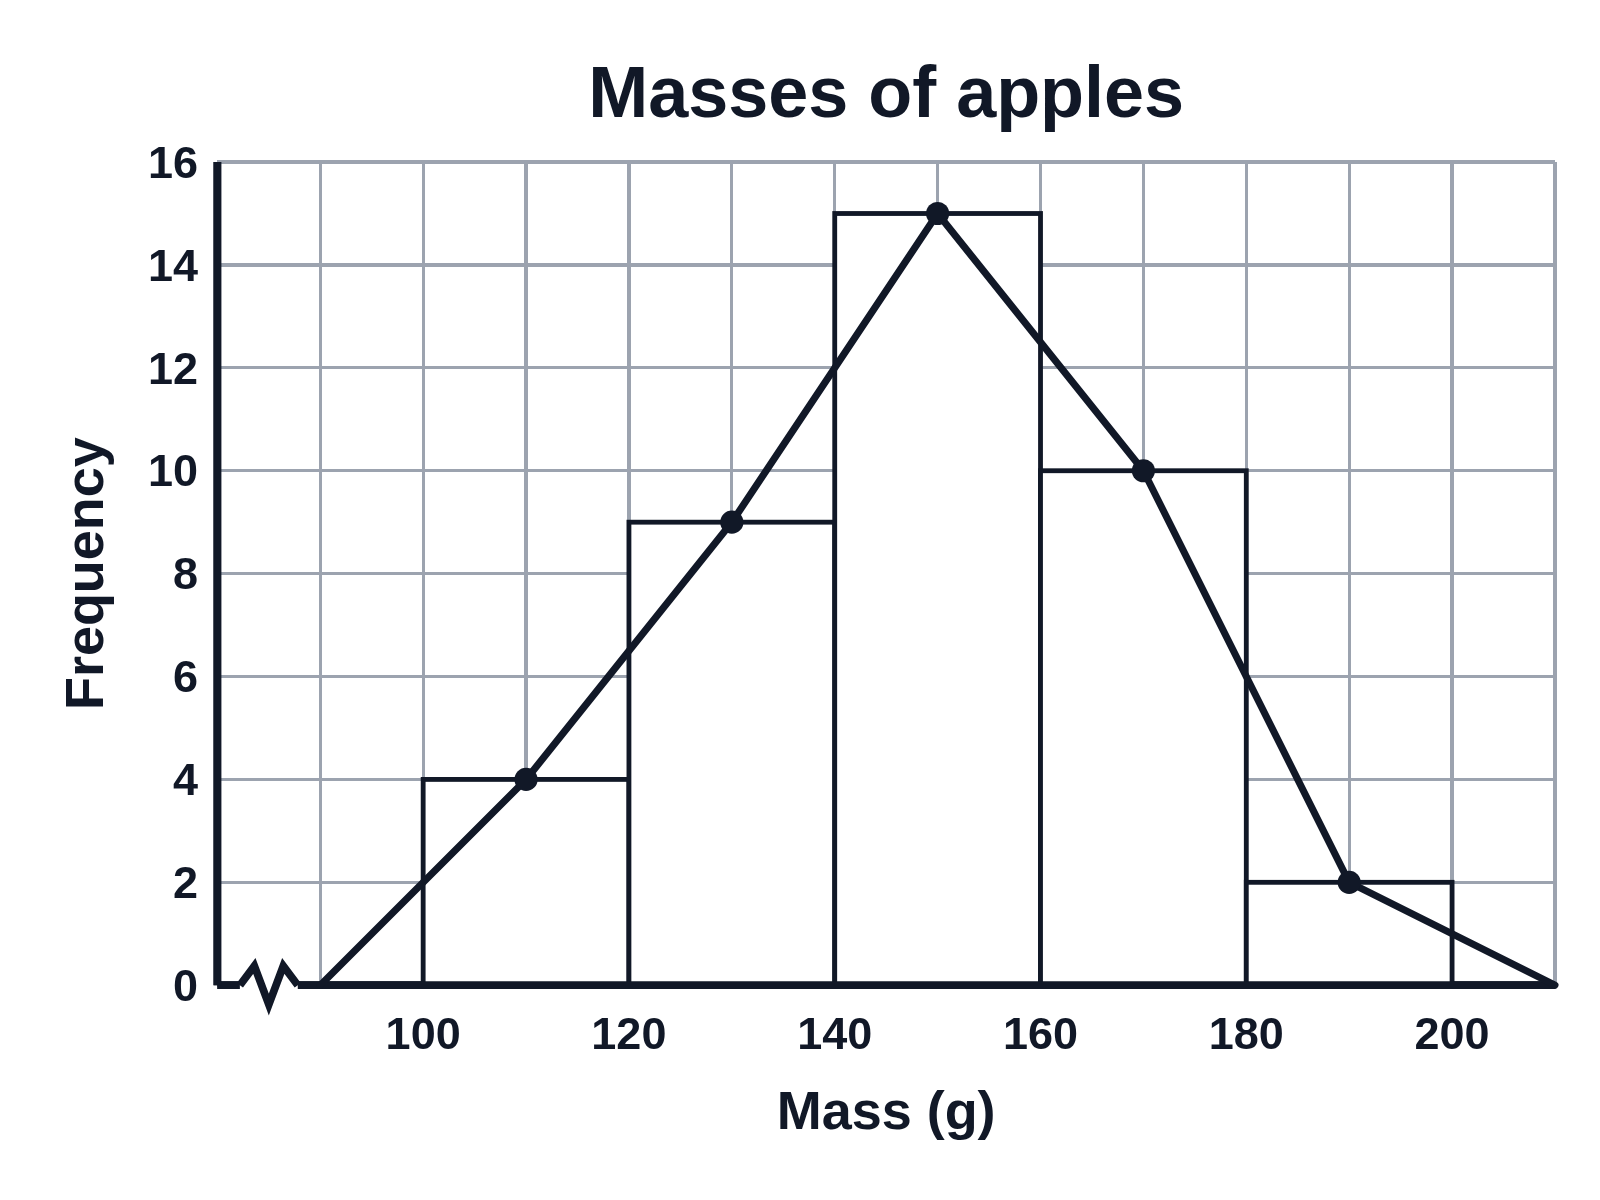
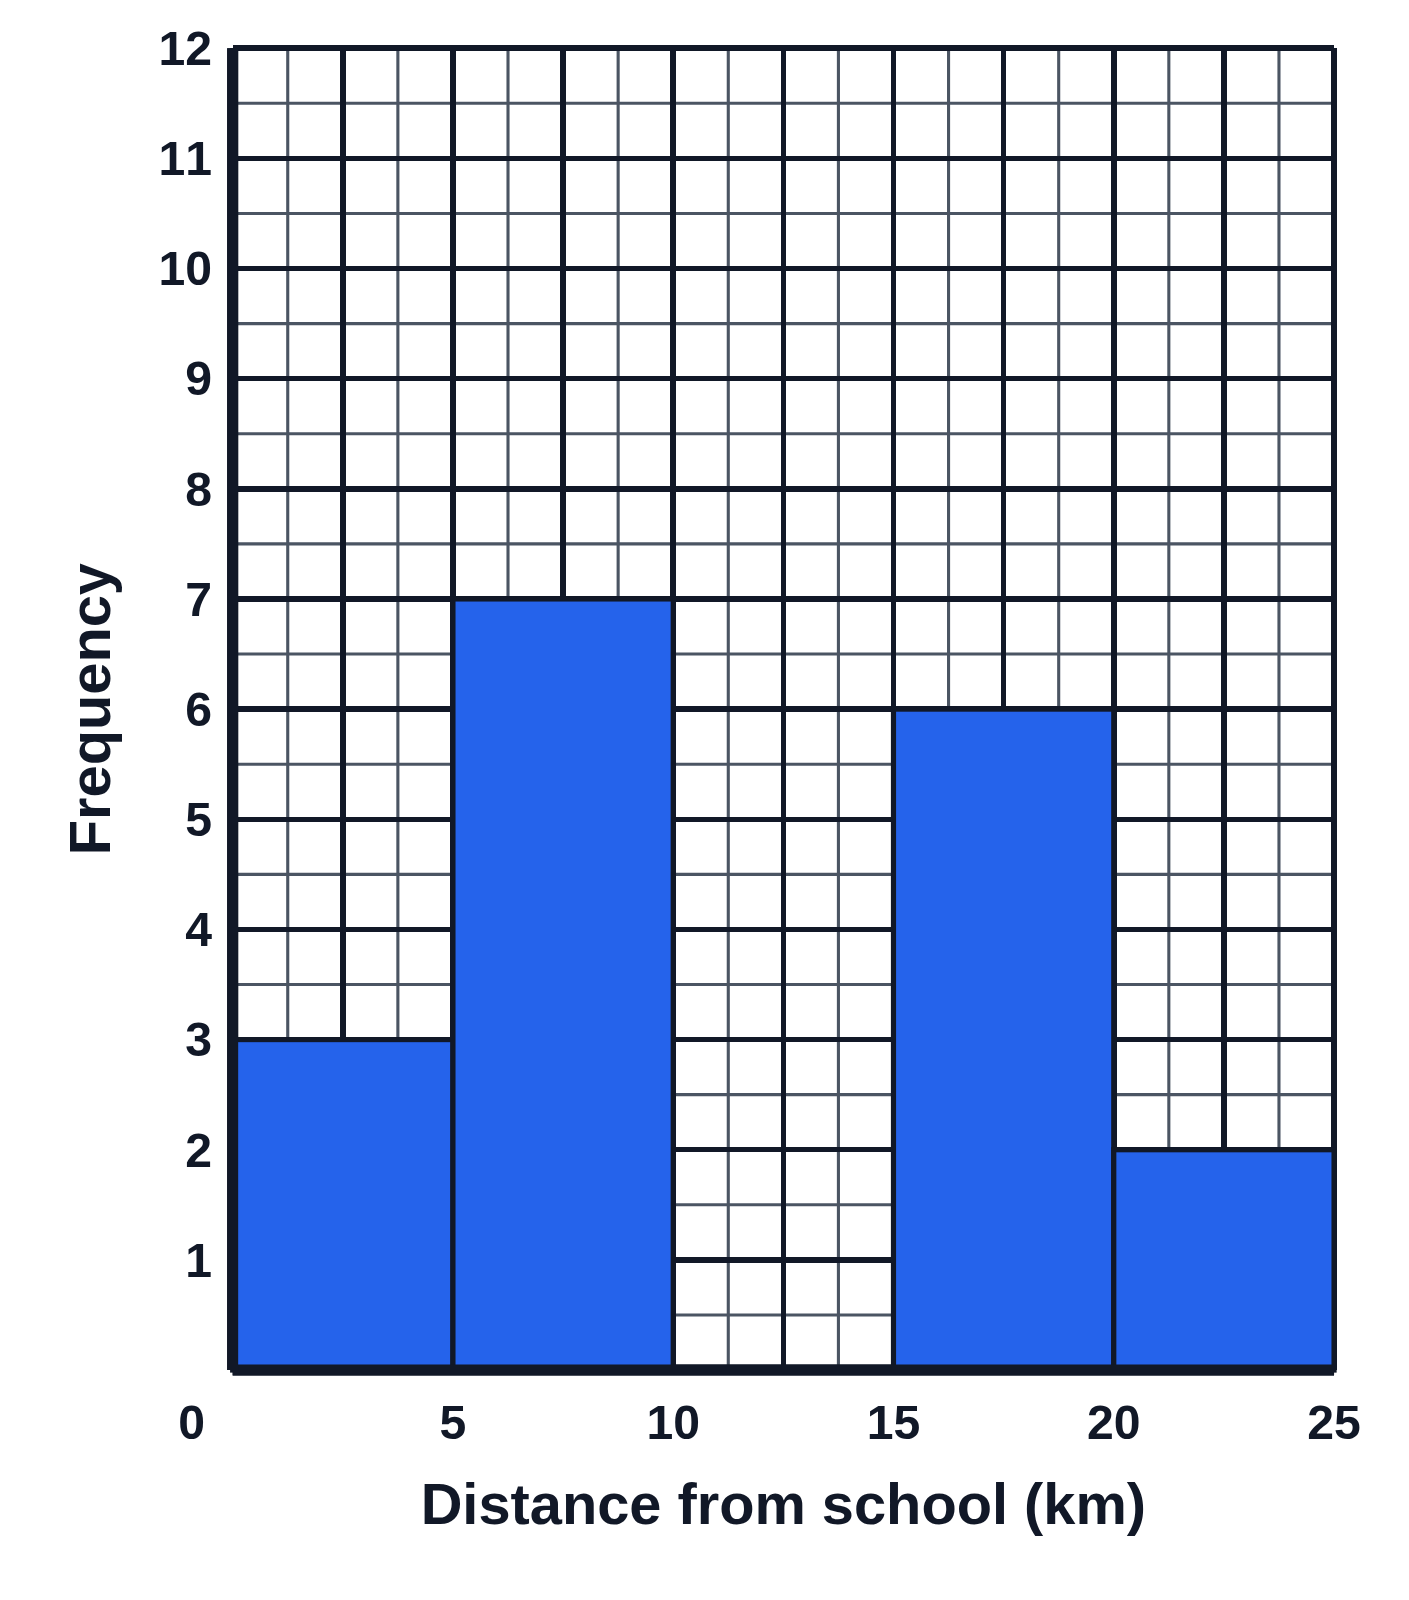
An example figure from the Histogram Generator.

A histogram titled Heights of students with six touching blue bars over bins from 150 to 180 cm, with a zig-zag break on the horizontal axis before 150
A histogram titled Heights of students, with six touching blue bars for the bins 150 ≤ h < 155 up to 175 ≤ h < 180. The horizontal axis is titled Height (cm) and numbered at the bin edges from 150 to 180, with a zig-zag break between the corner and 150. The vertical axis is titled Frequency and numbered from 0 to 11, and the tallest bar, 165 to 170, reaches 11.

Editing opens it in the Histogram Generator with these settings, to change anything and copy or download your own.

Free to use in your tests, worksheets, slides or anything else, no credit needed. Public domain under CC0 1.0. How to reuse our figures

More Histogram examples