Plotting points in all four quadrants

An example figure from the Coordinate Grid Generator.
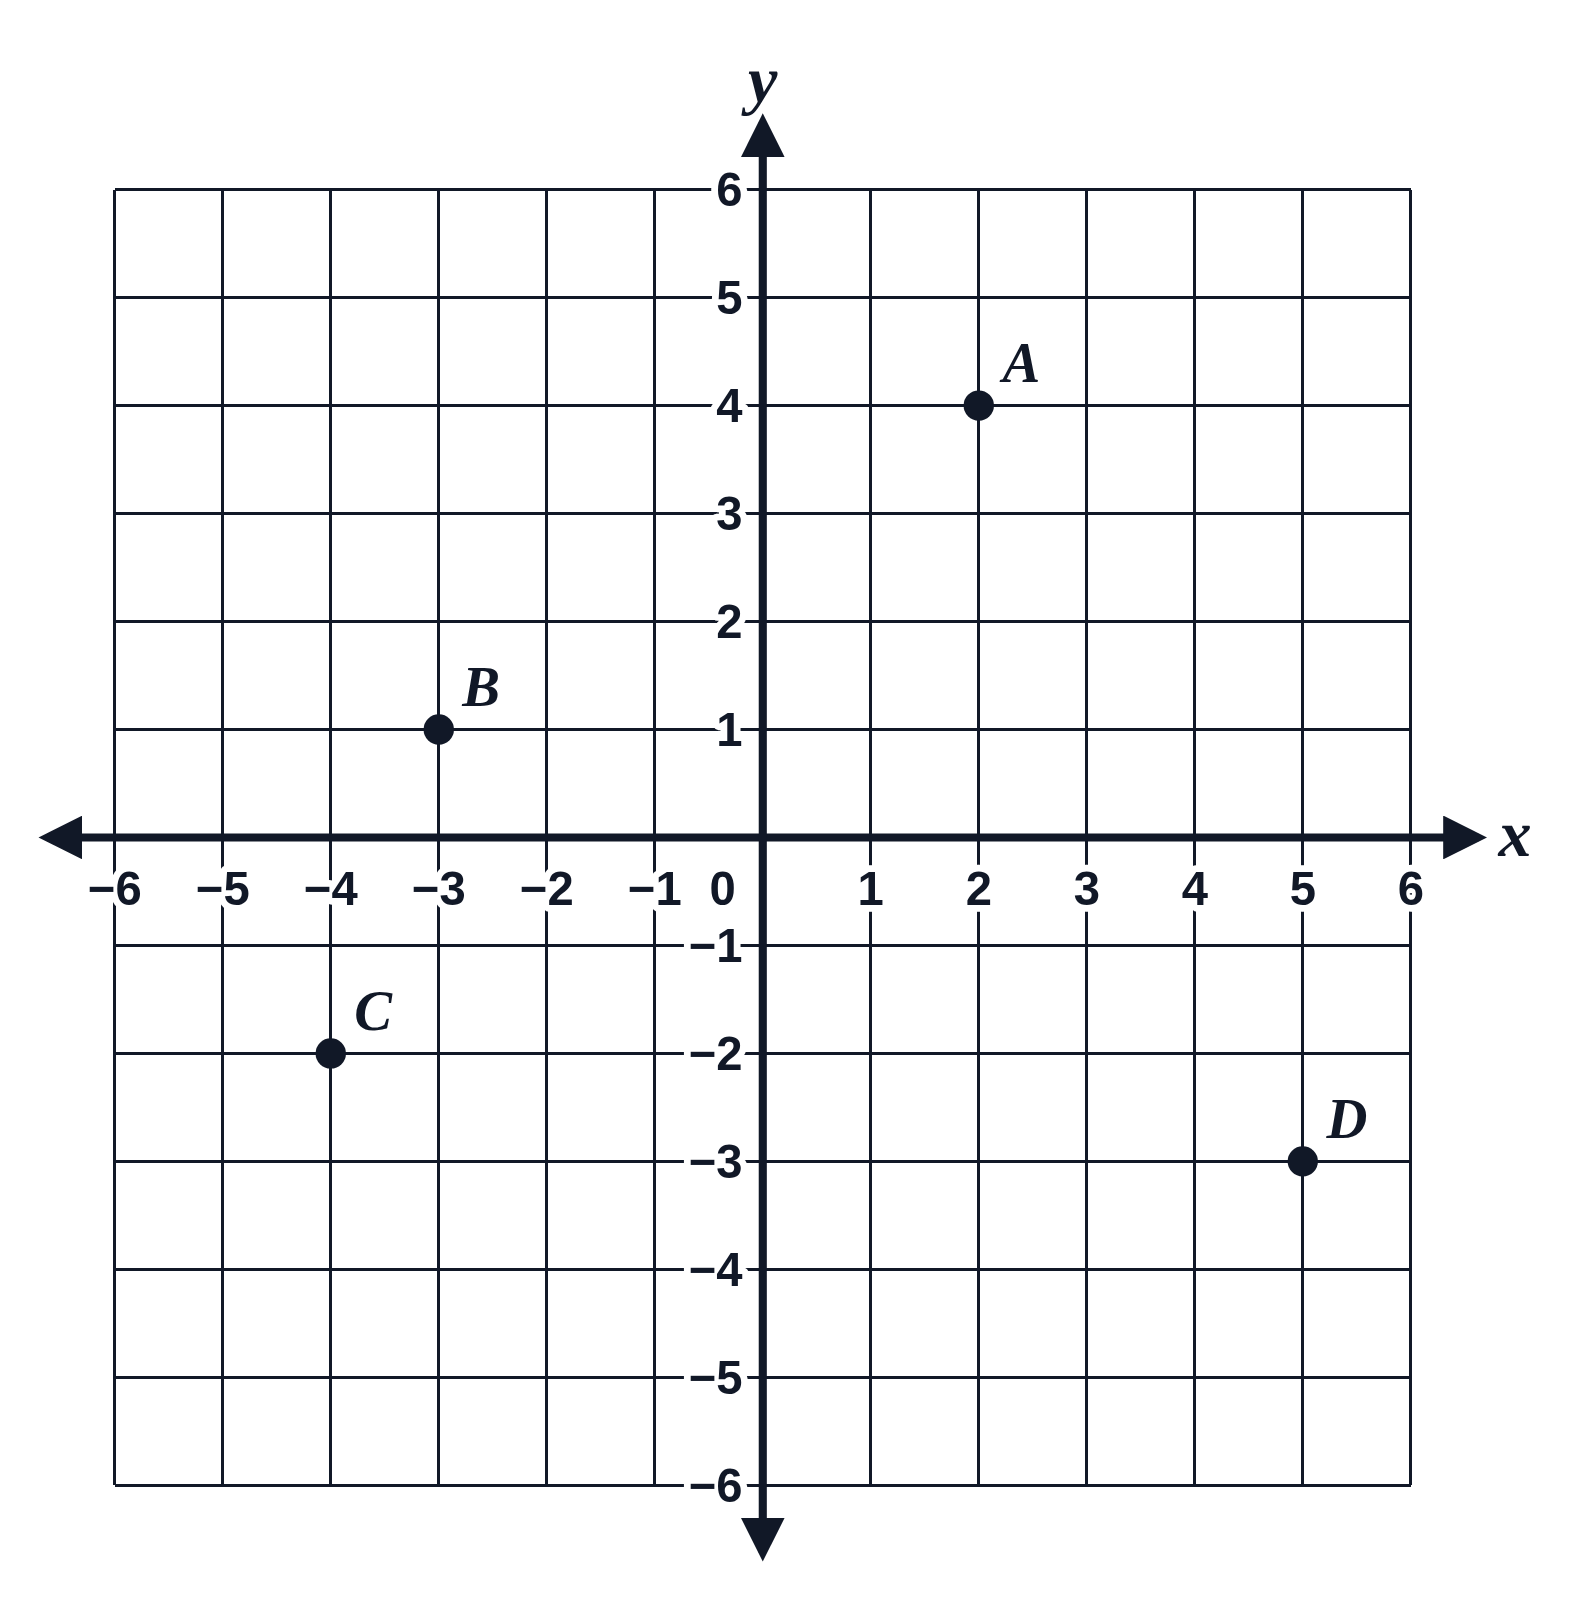
A coordinate grid from −6 to 6 with four labeled points, A(2, 4), B(−3, 1), C(−4, −2) and D(5, −3), one in each quadrant
A coordinate grid numbered from −6 to 6 on both axes, with four points drawn as dots and labeled with their letters only: A in the first quadrant, B in the second, C in the third and D in the fourth. Students read each point’s coordinates, or name the quadrant it’s in.

Editing opens it in the Coordinate Grid Generator with these settings, to change anything and copy or download your own.

Answer key

  • A(2, 4), B(−3, 1), C(−4, −2), D(5, −3)

Free to use in your tests, worksheets, slides or anything else. Open source under Apache 2.0. How to reuse our figures
More Coordinate Grid examples