
Piecewise function graph with open and closed circles
An example figure from the Coordinate Grid Generator.
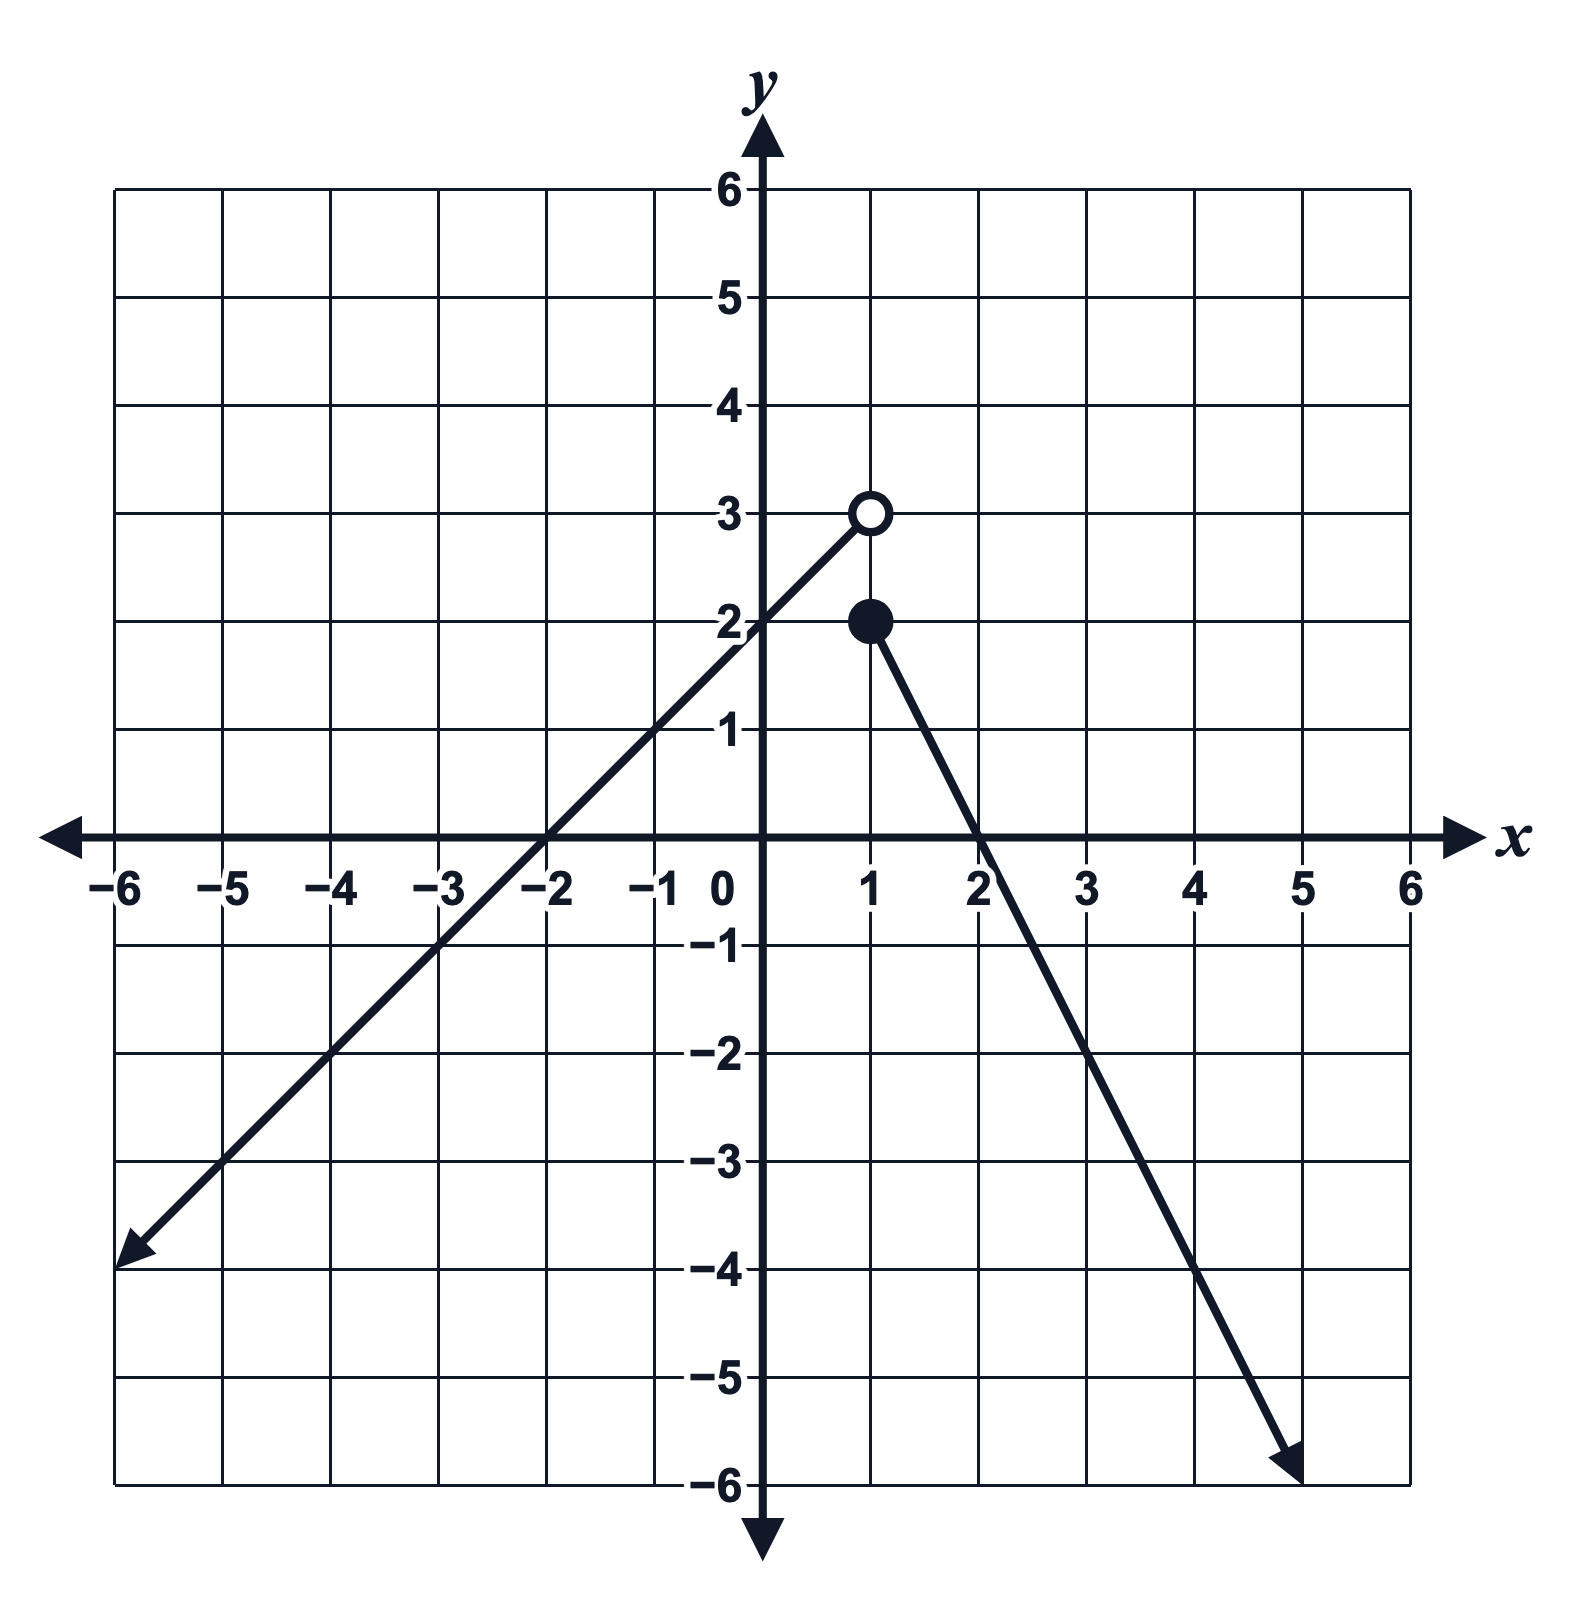
Editing opens it in the Coordinate Grid Generator with these settings, to change anything and copy or download your own.
Answer key
- y = x + 2, x < 1: slope 1, y-intercept 2
- y = −2x + 4, x ≥ 1: slope −2, y-intercept 4
Free to use in your tests, worksheets, slides or anything else, no credit needed. Public domain under CC0 1.0. How to reuse our figures
More Coordinate Grid examples
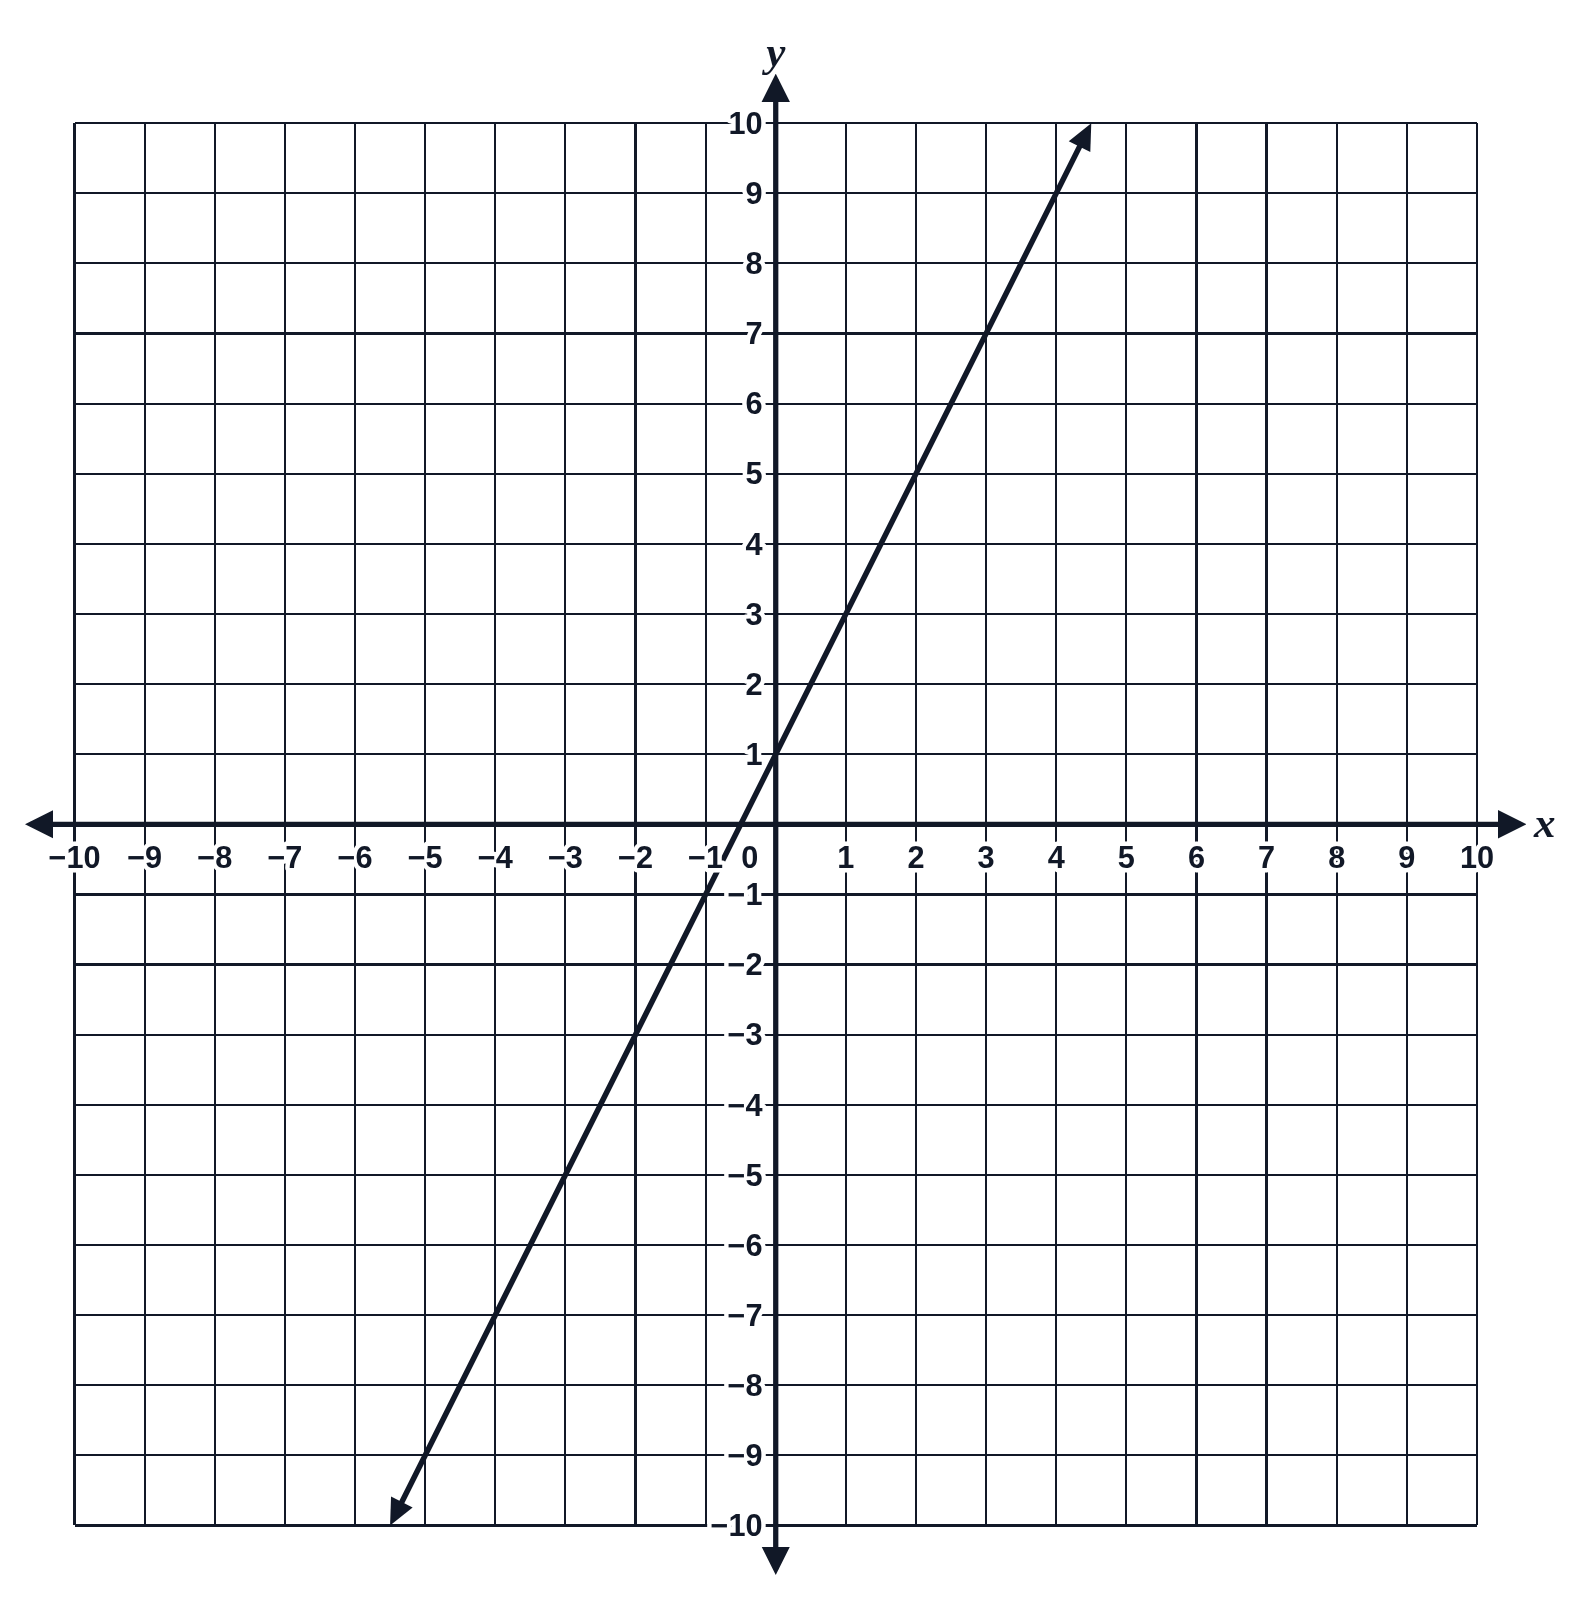 Graph of y = 2x + 1 on a coordinate plane
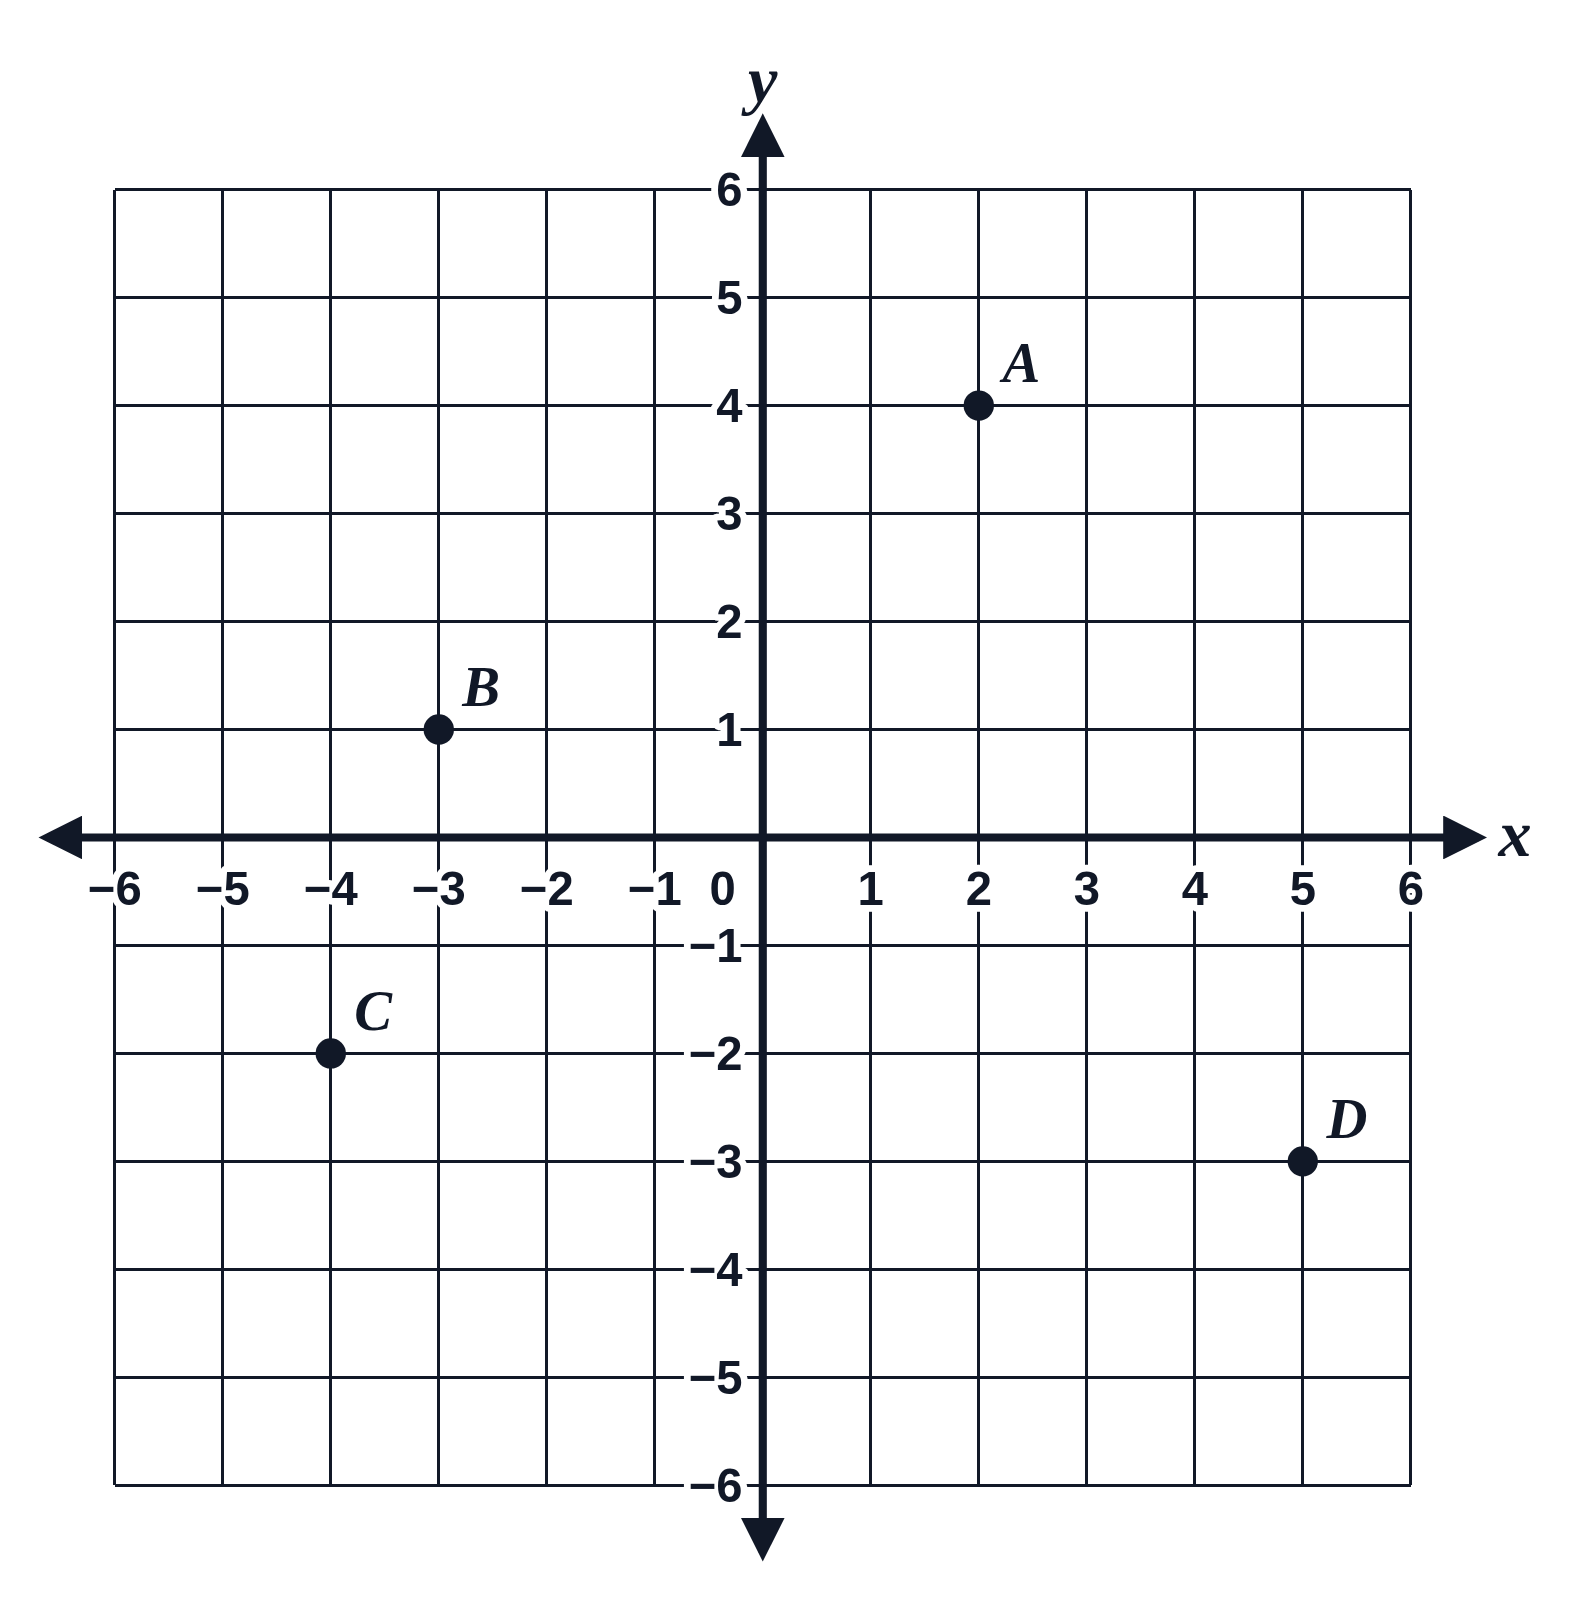 Plotting points in all four quadrants
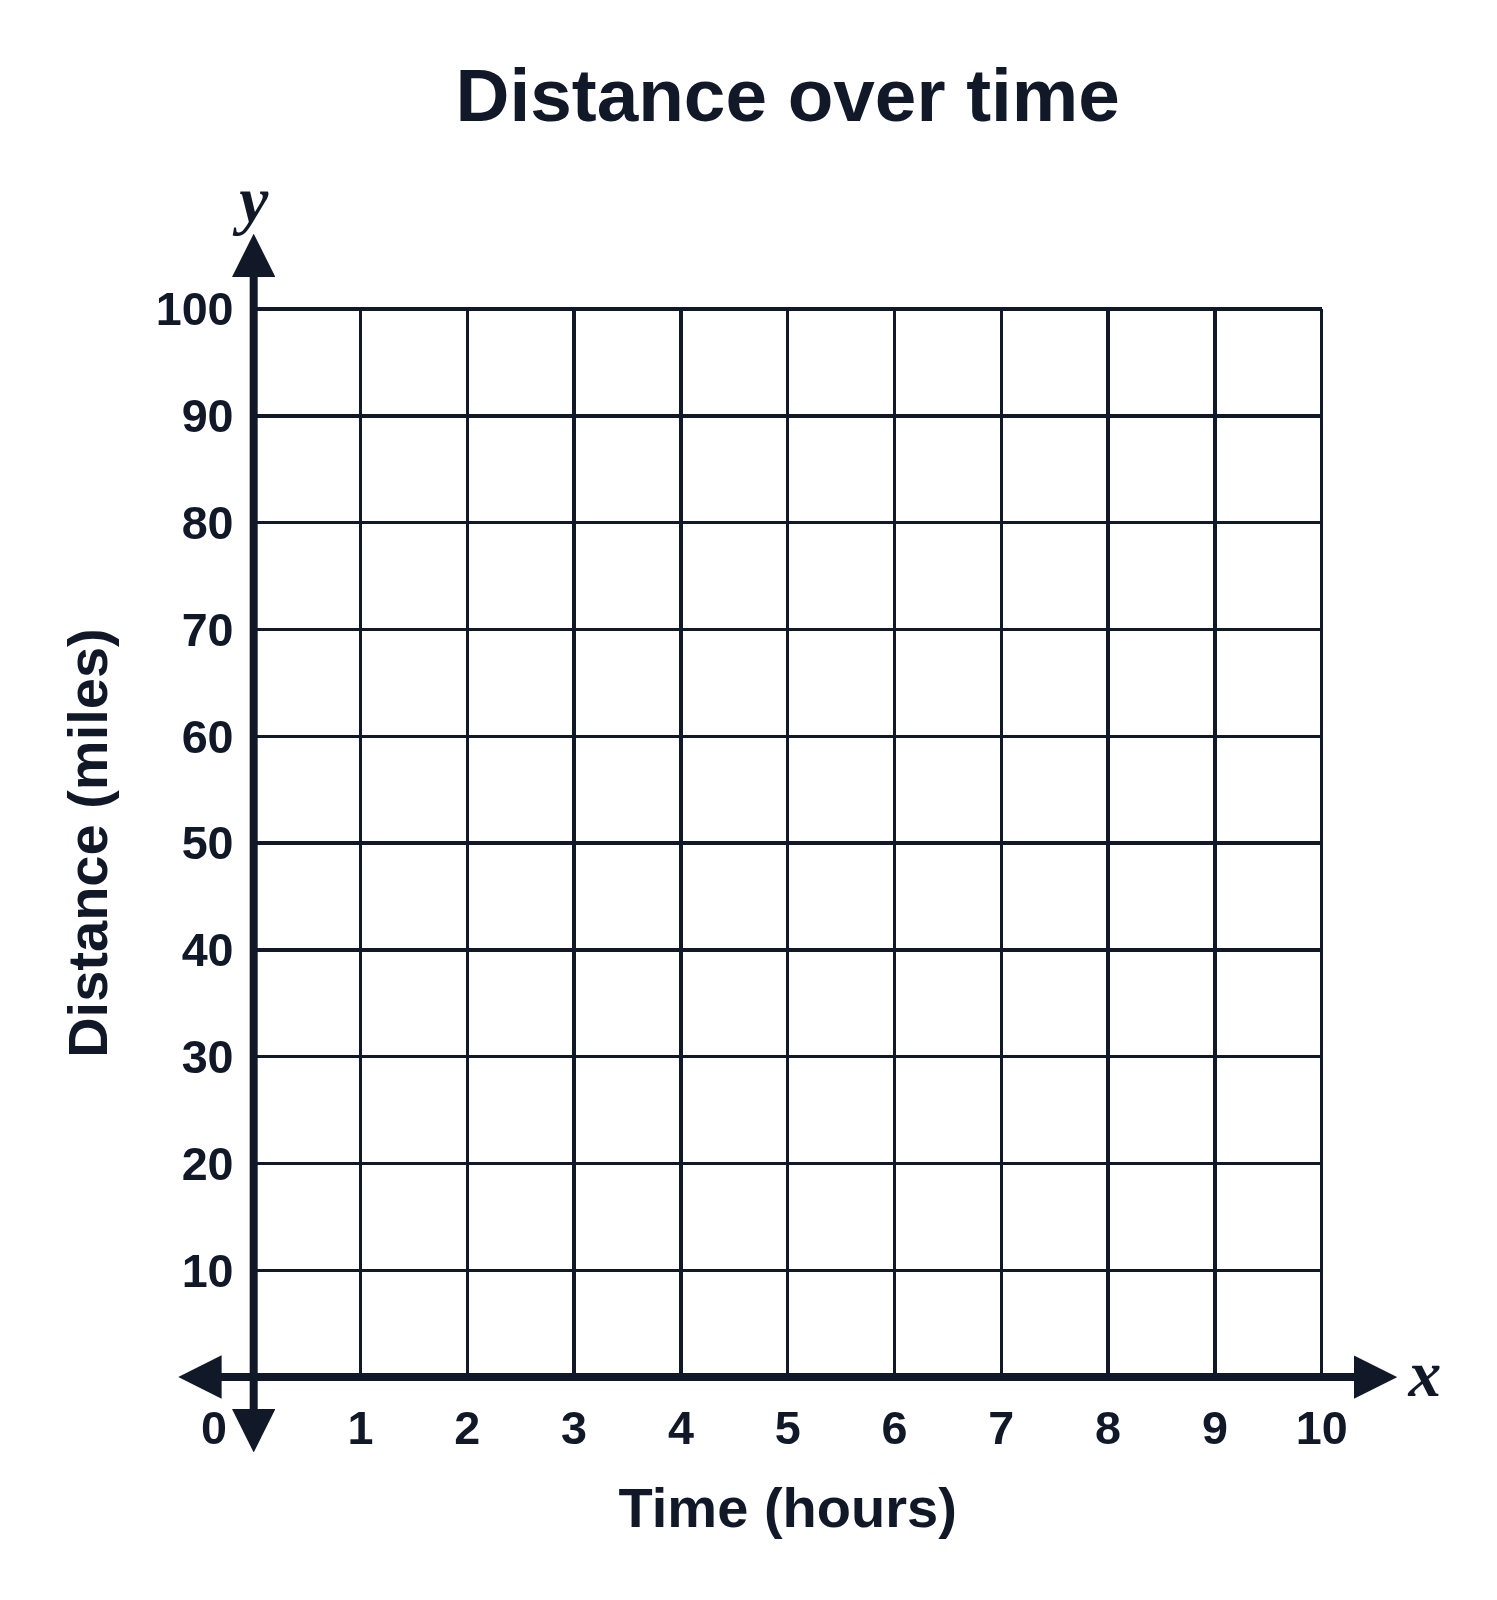 First-quadrant graph with axis titles: distance over time
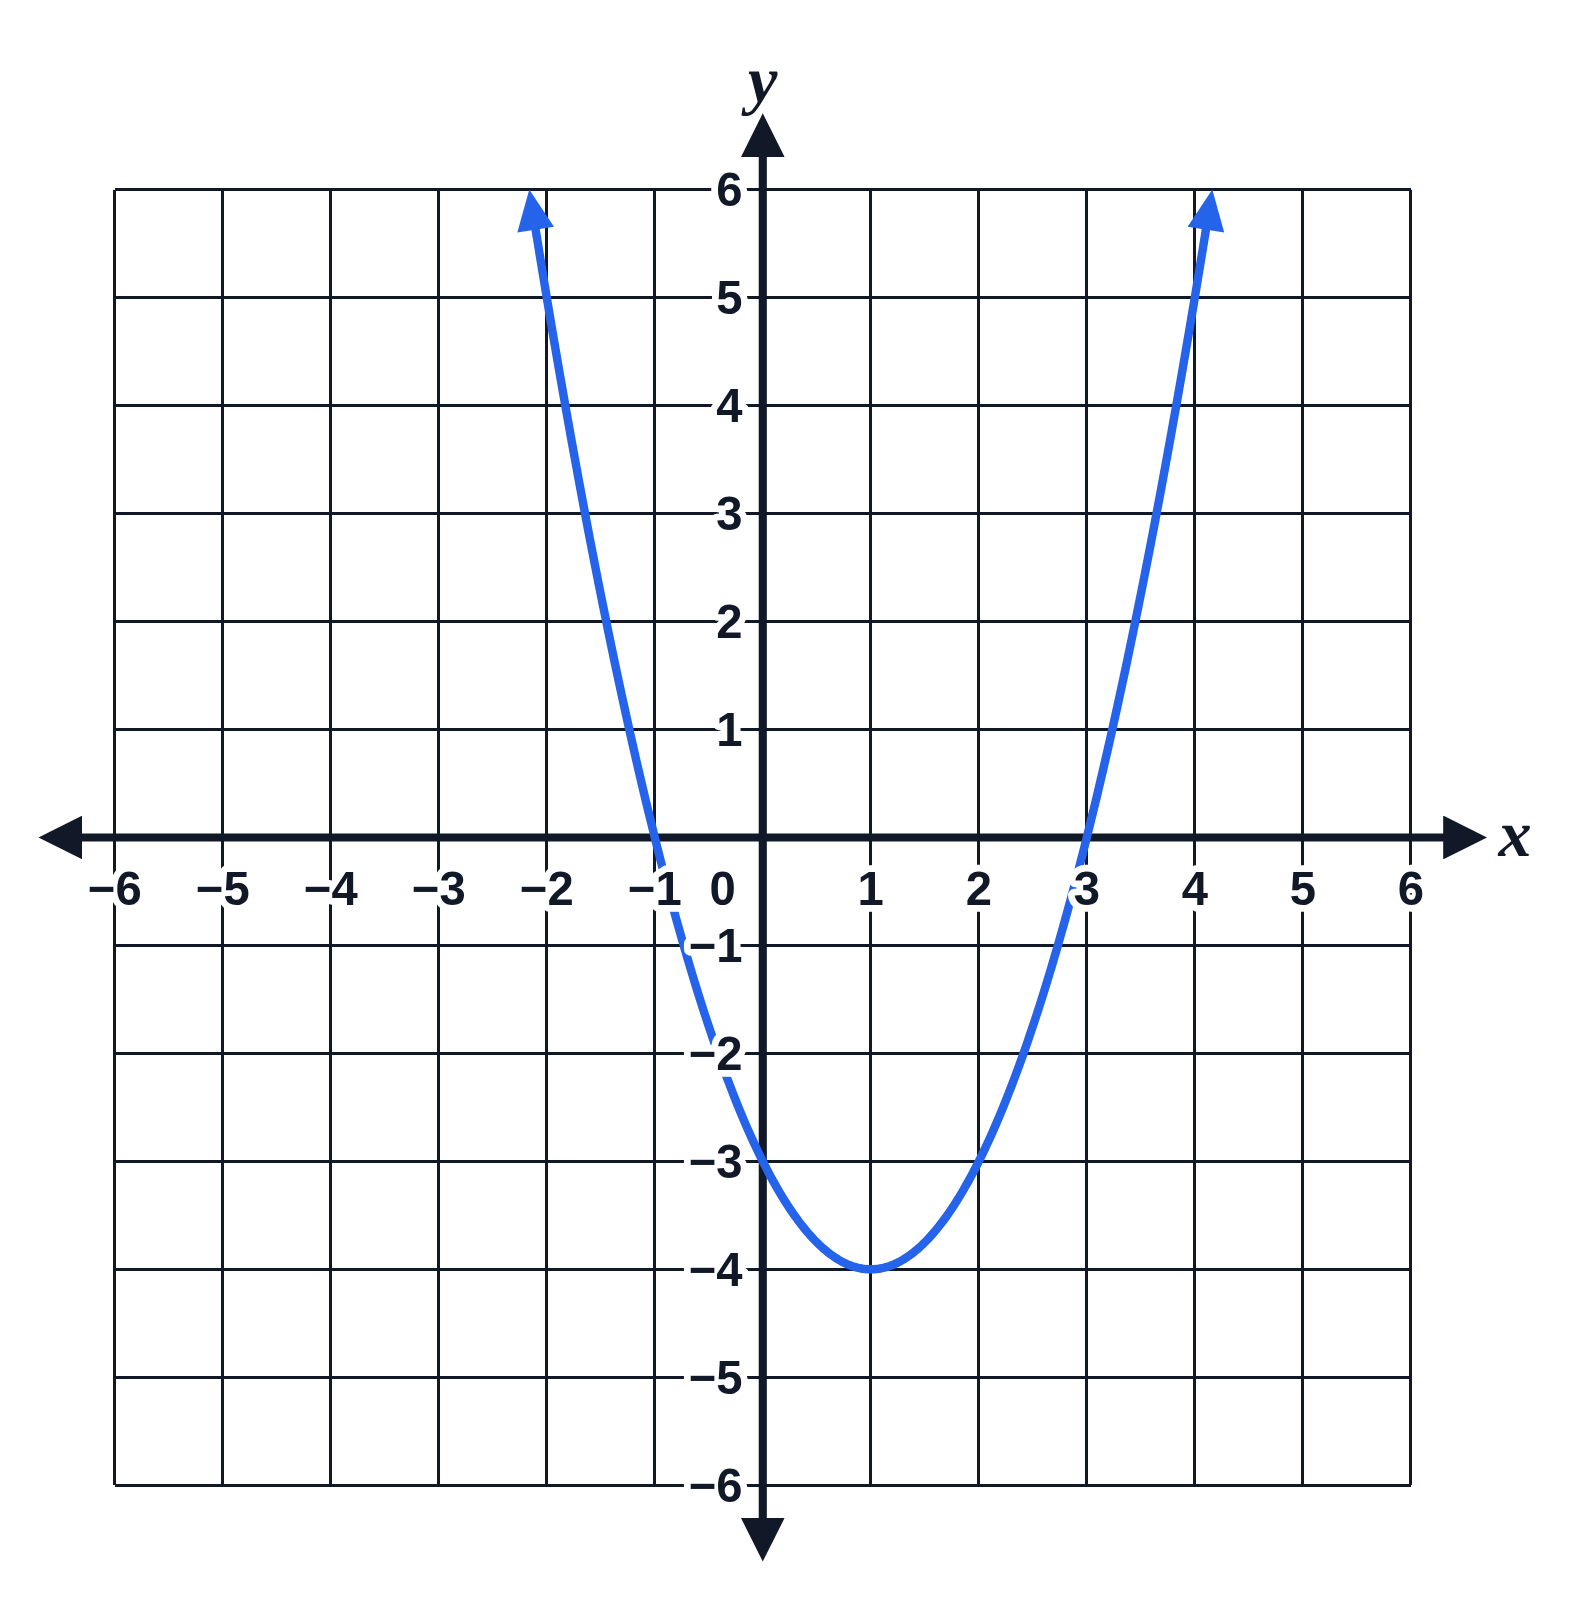 Graph of the parabola y = x² − 2x − 3
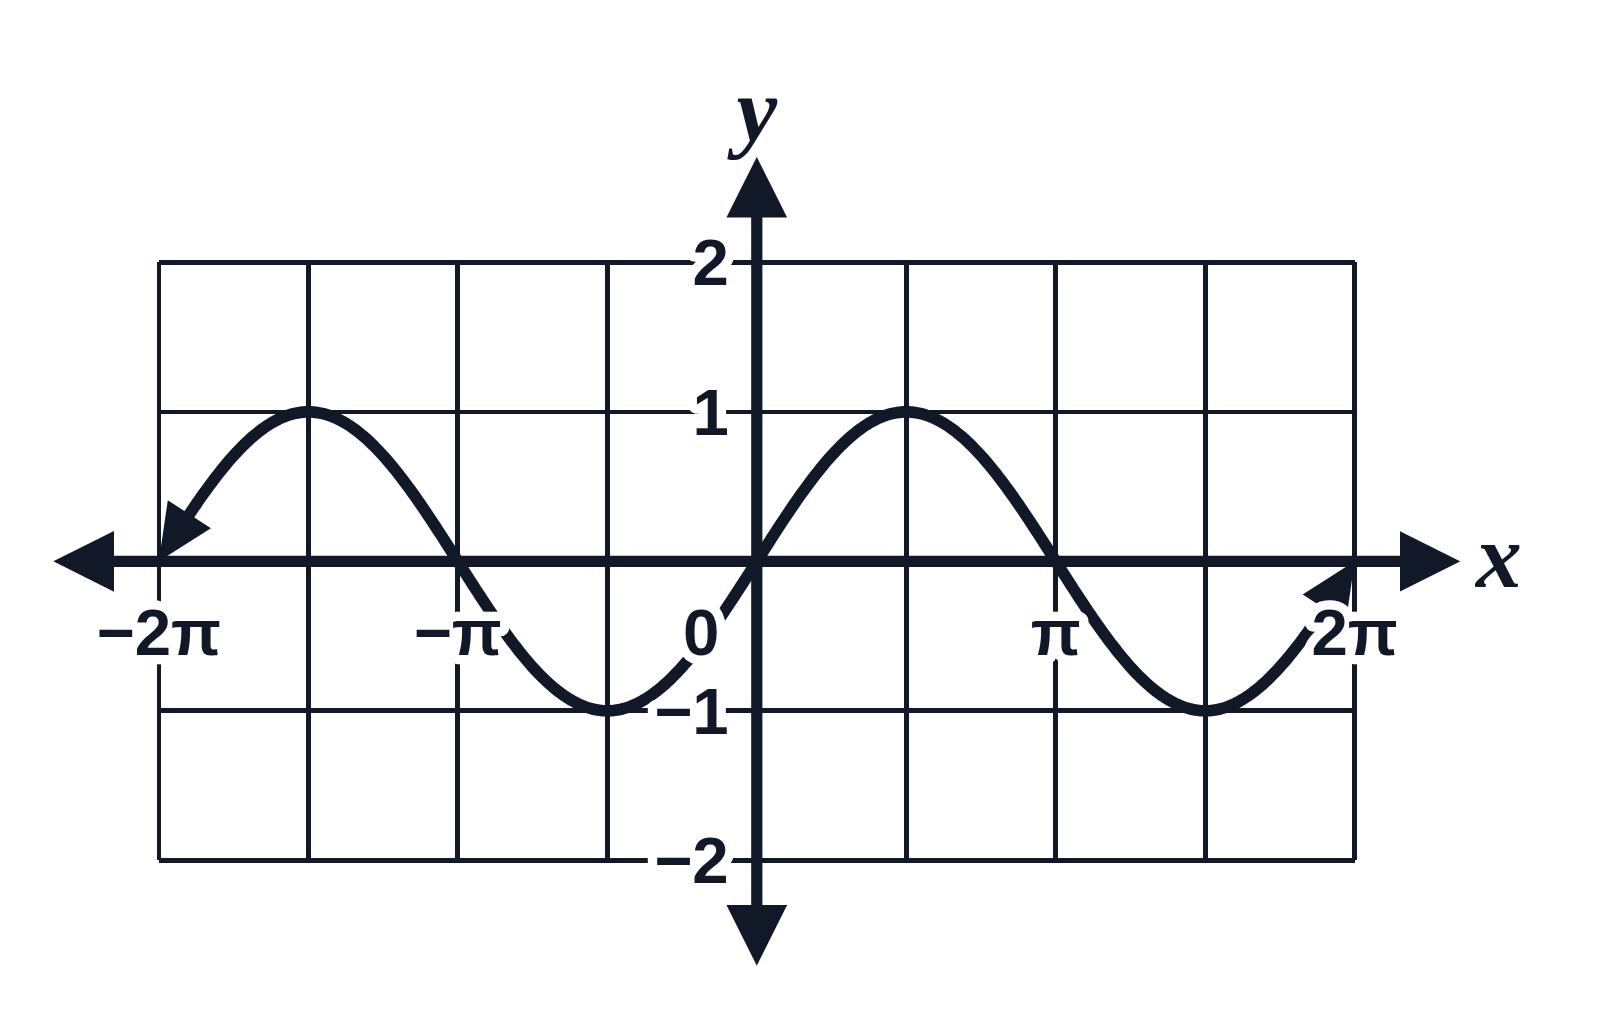 Graph of y = sin x from −2π to 2π
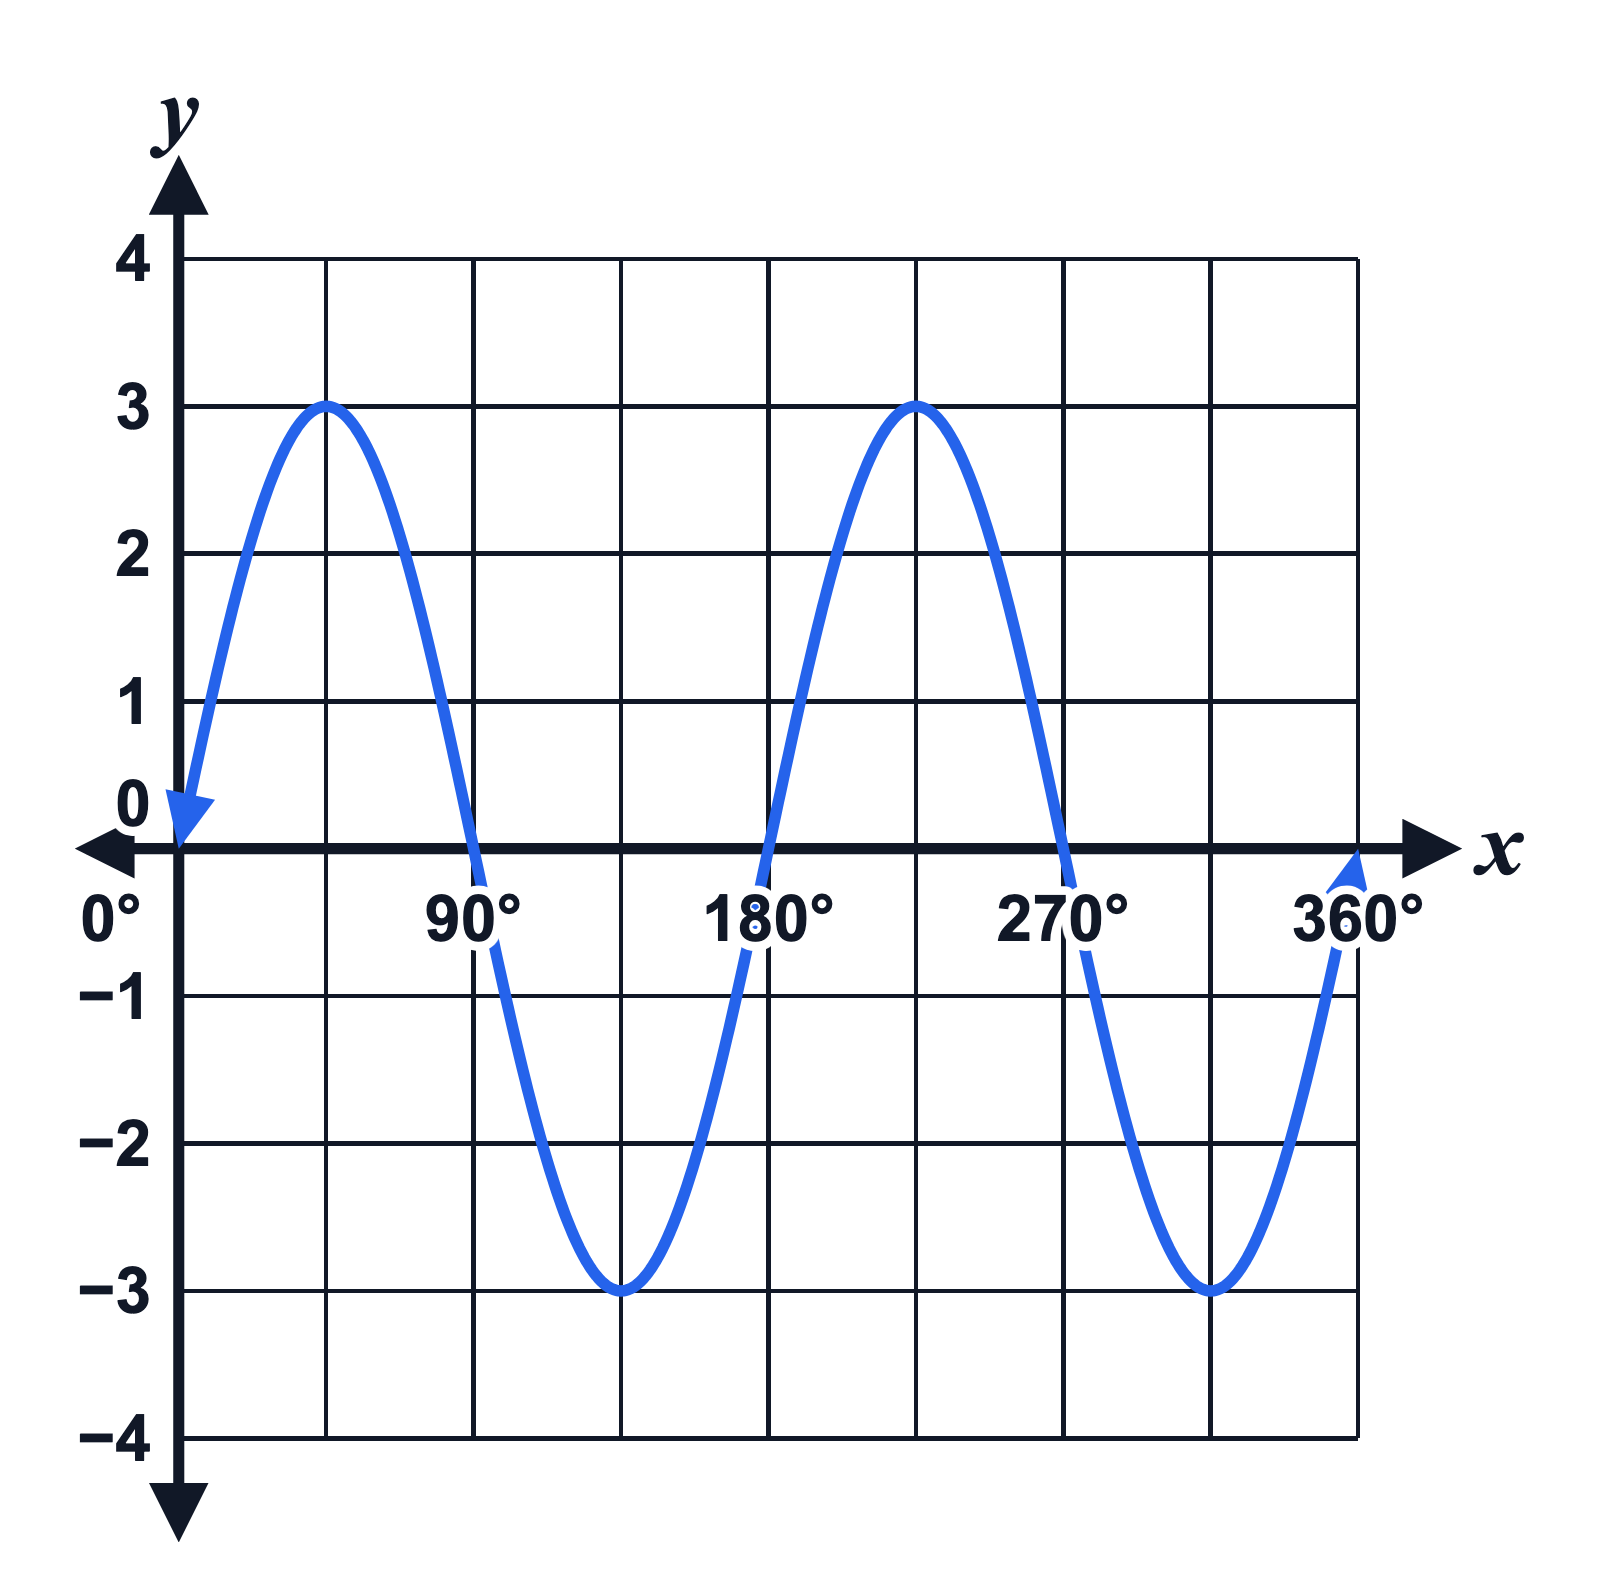 Graph of y = 3 sin 2x in degrees, from 0° to 360°
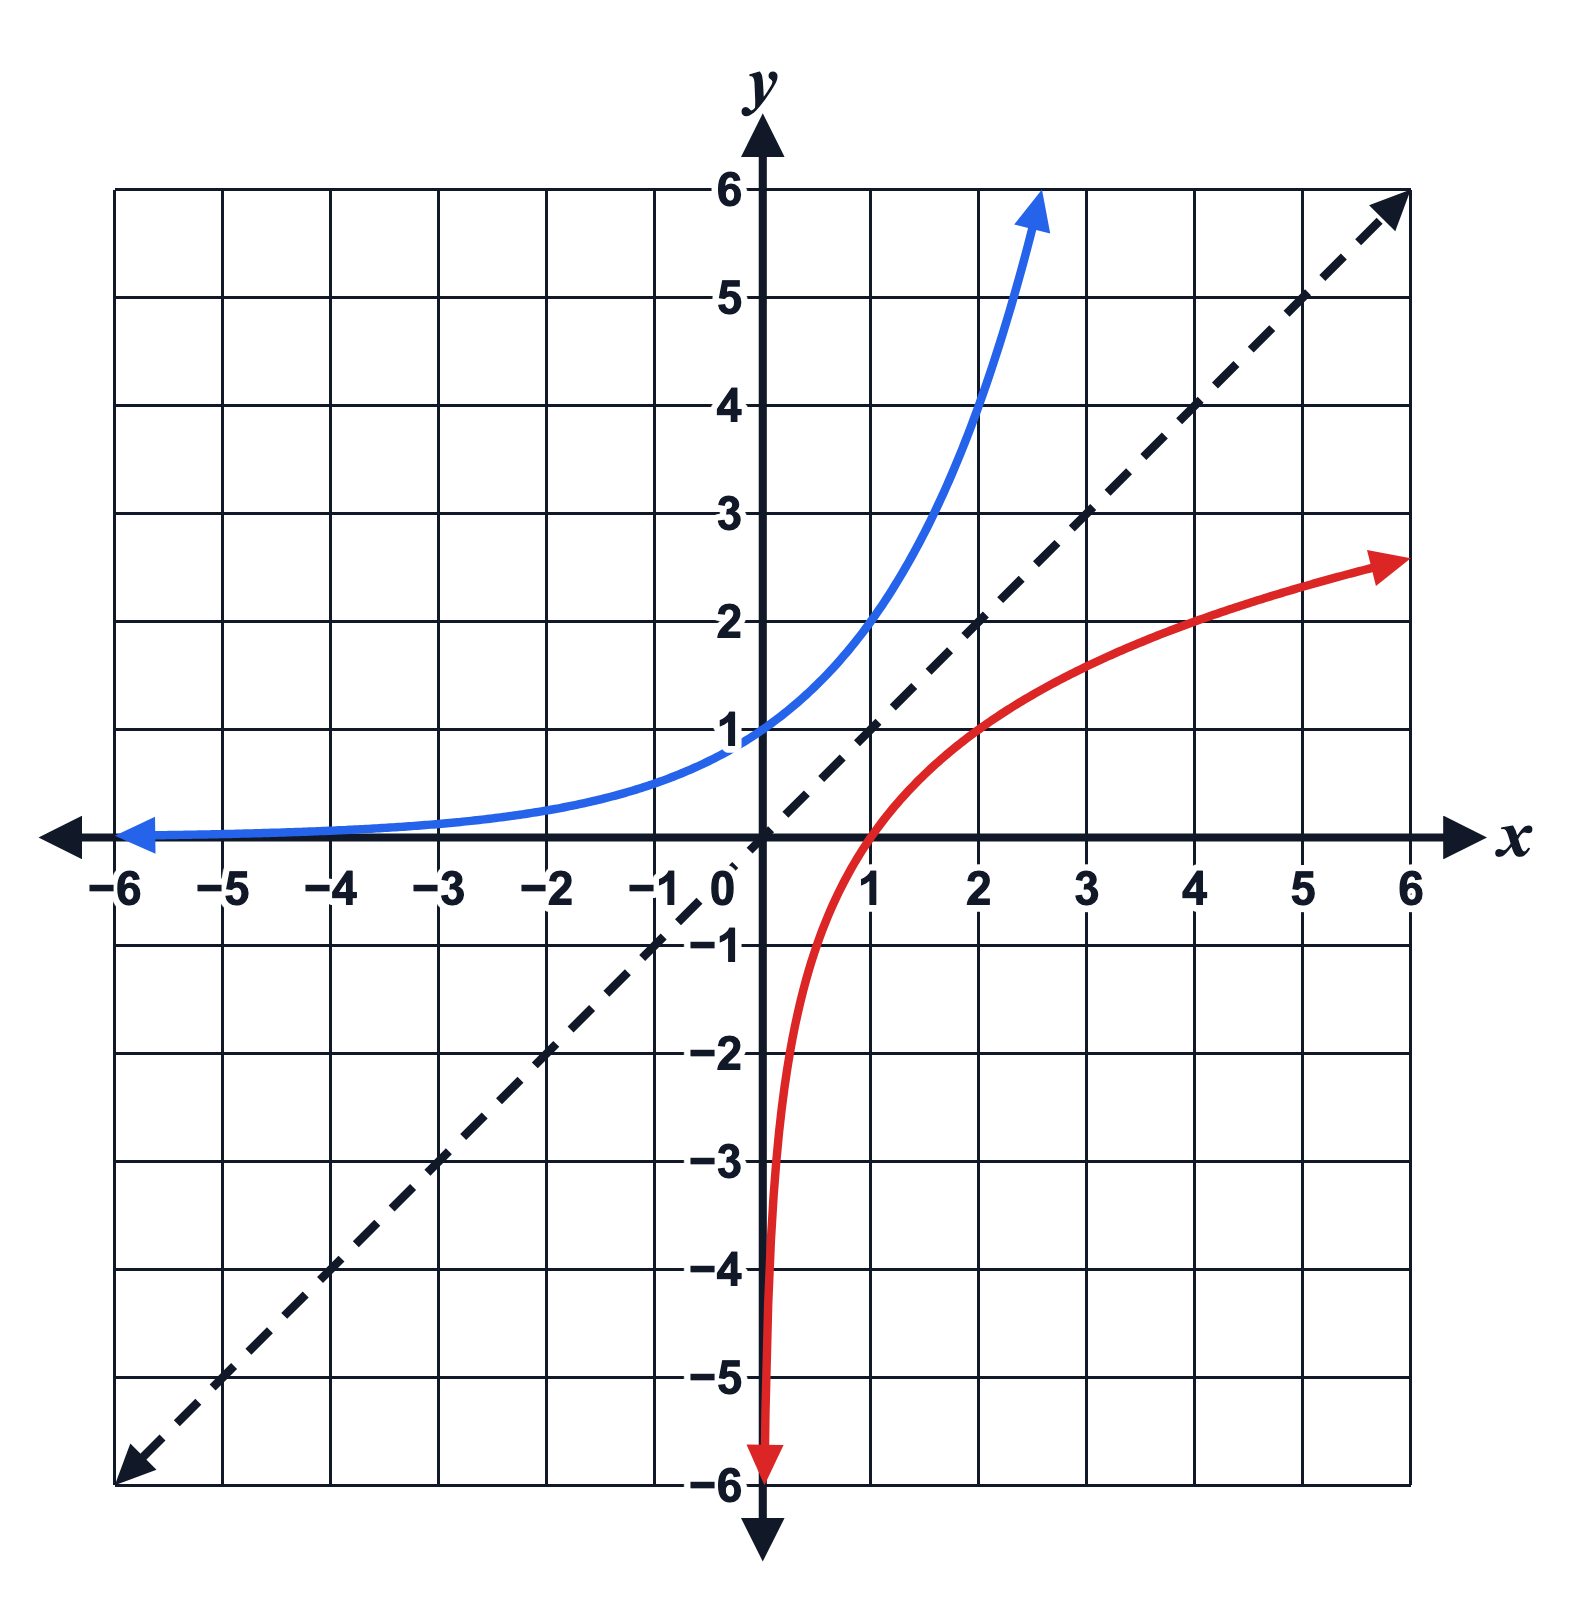 Graphs of y = 2ˣ and y = log₂ x, reflected in y = x
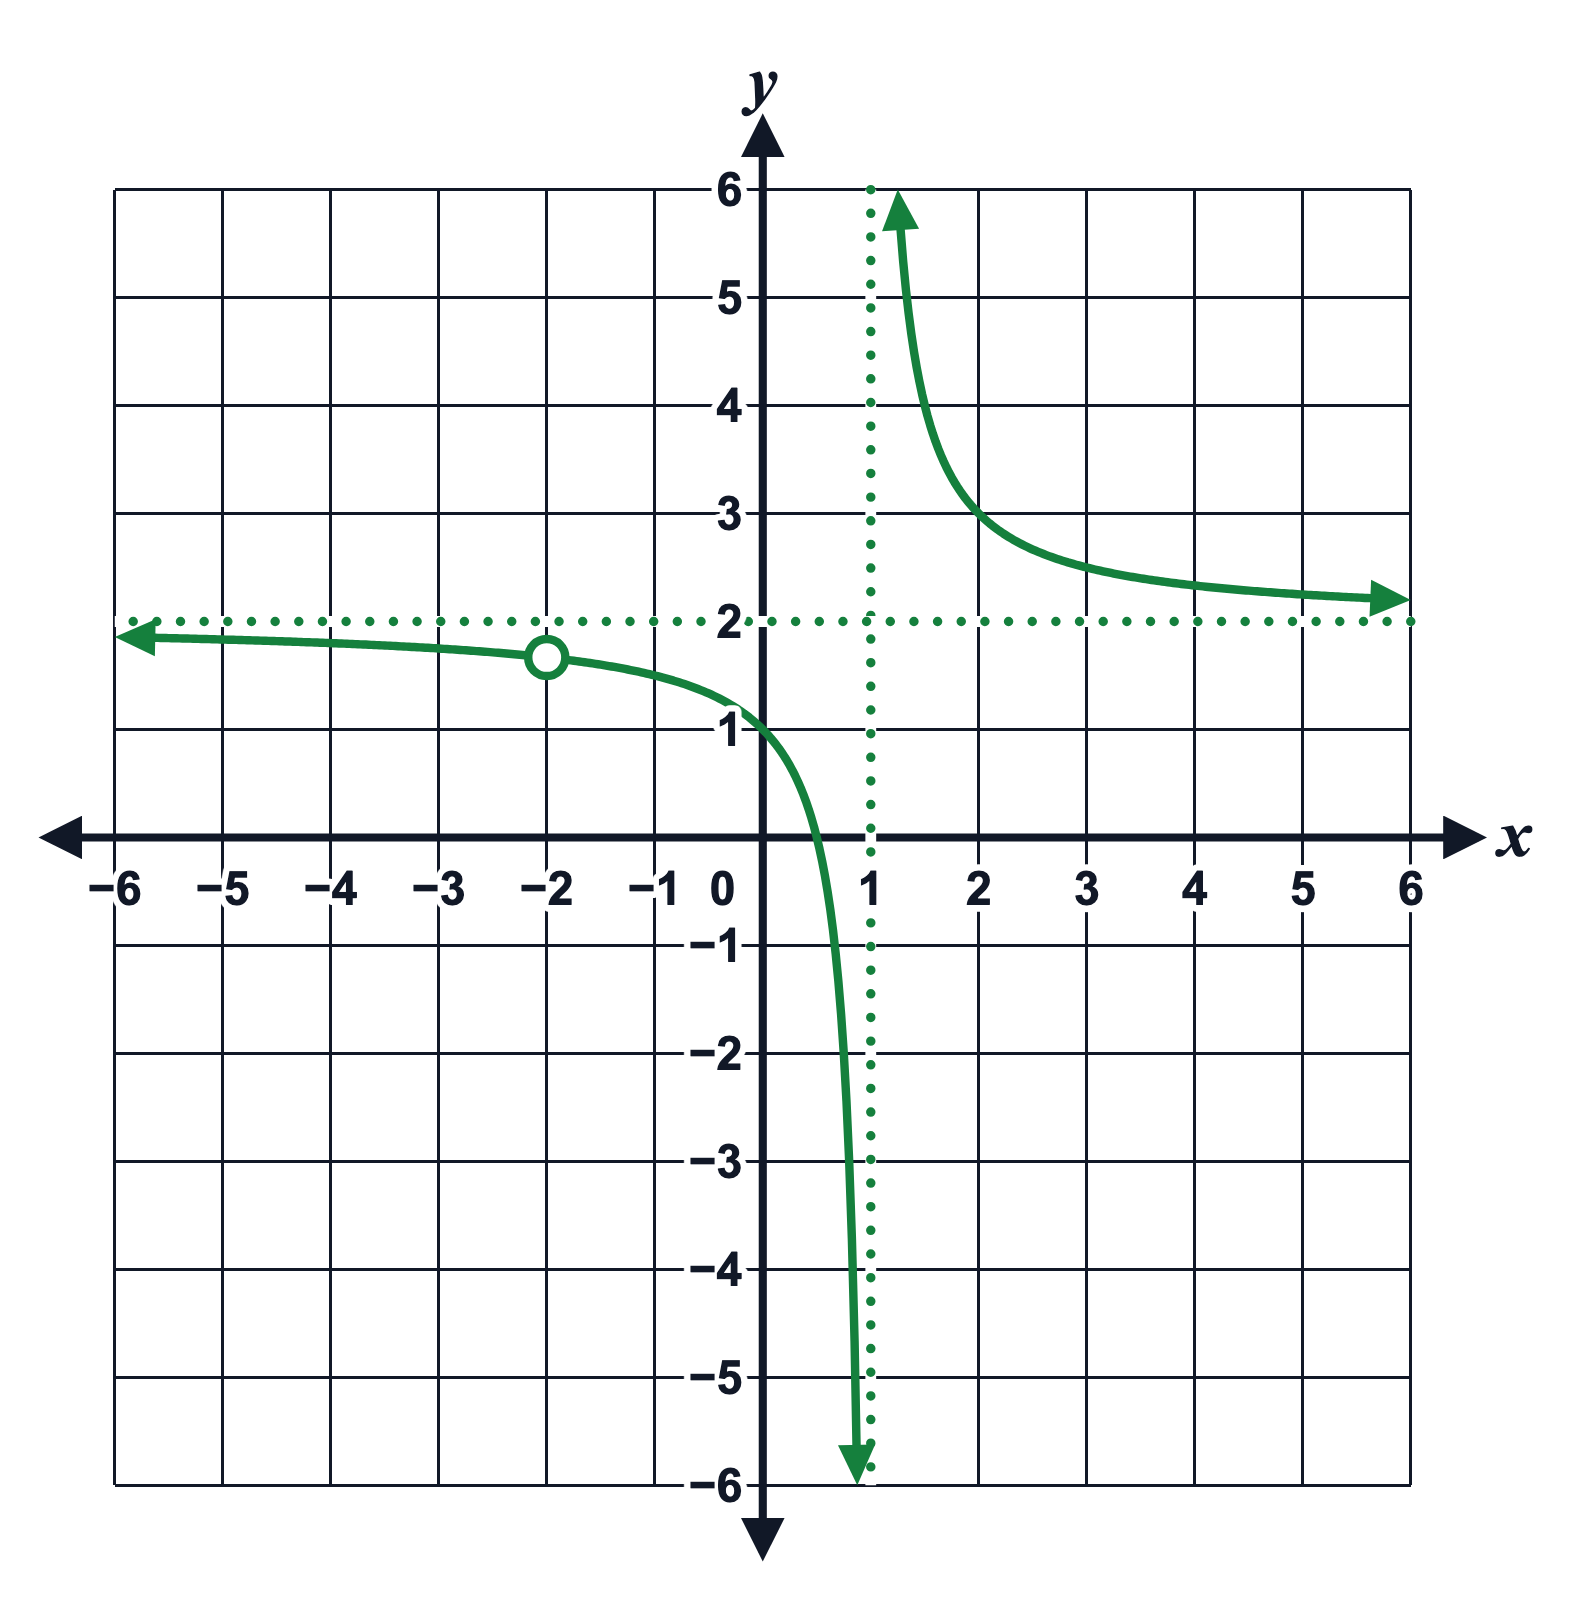 Rational function with a hole and dotted asymptotes
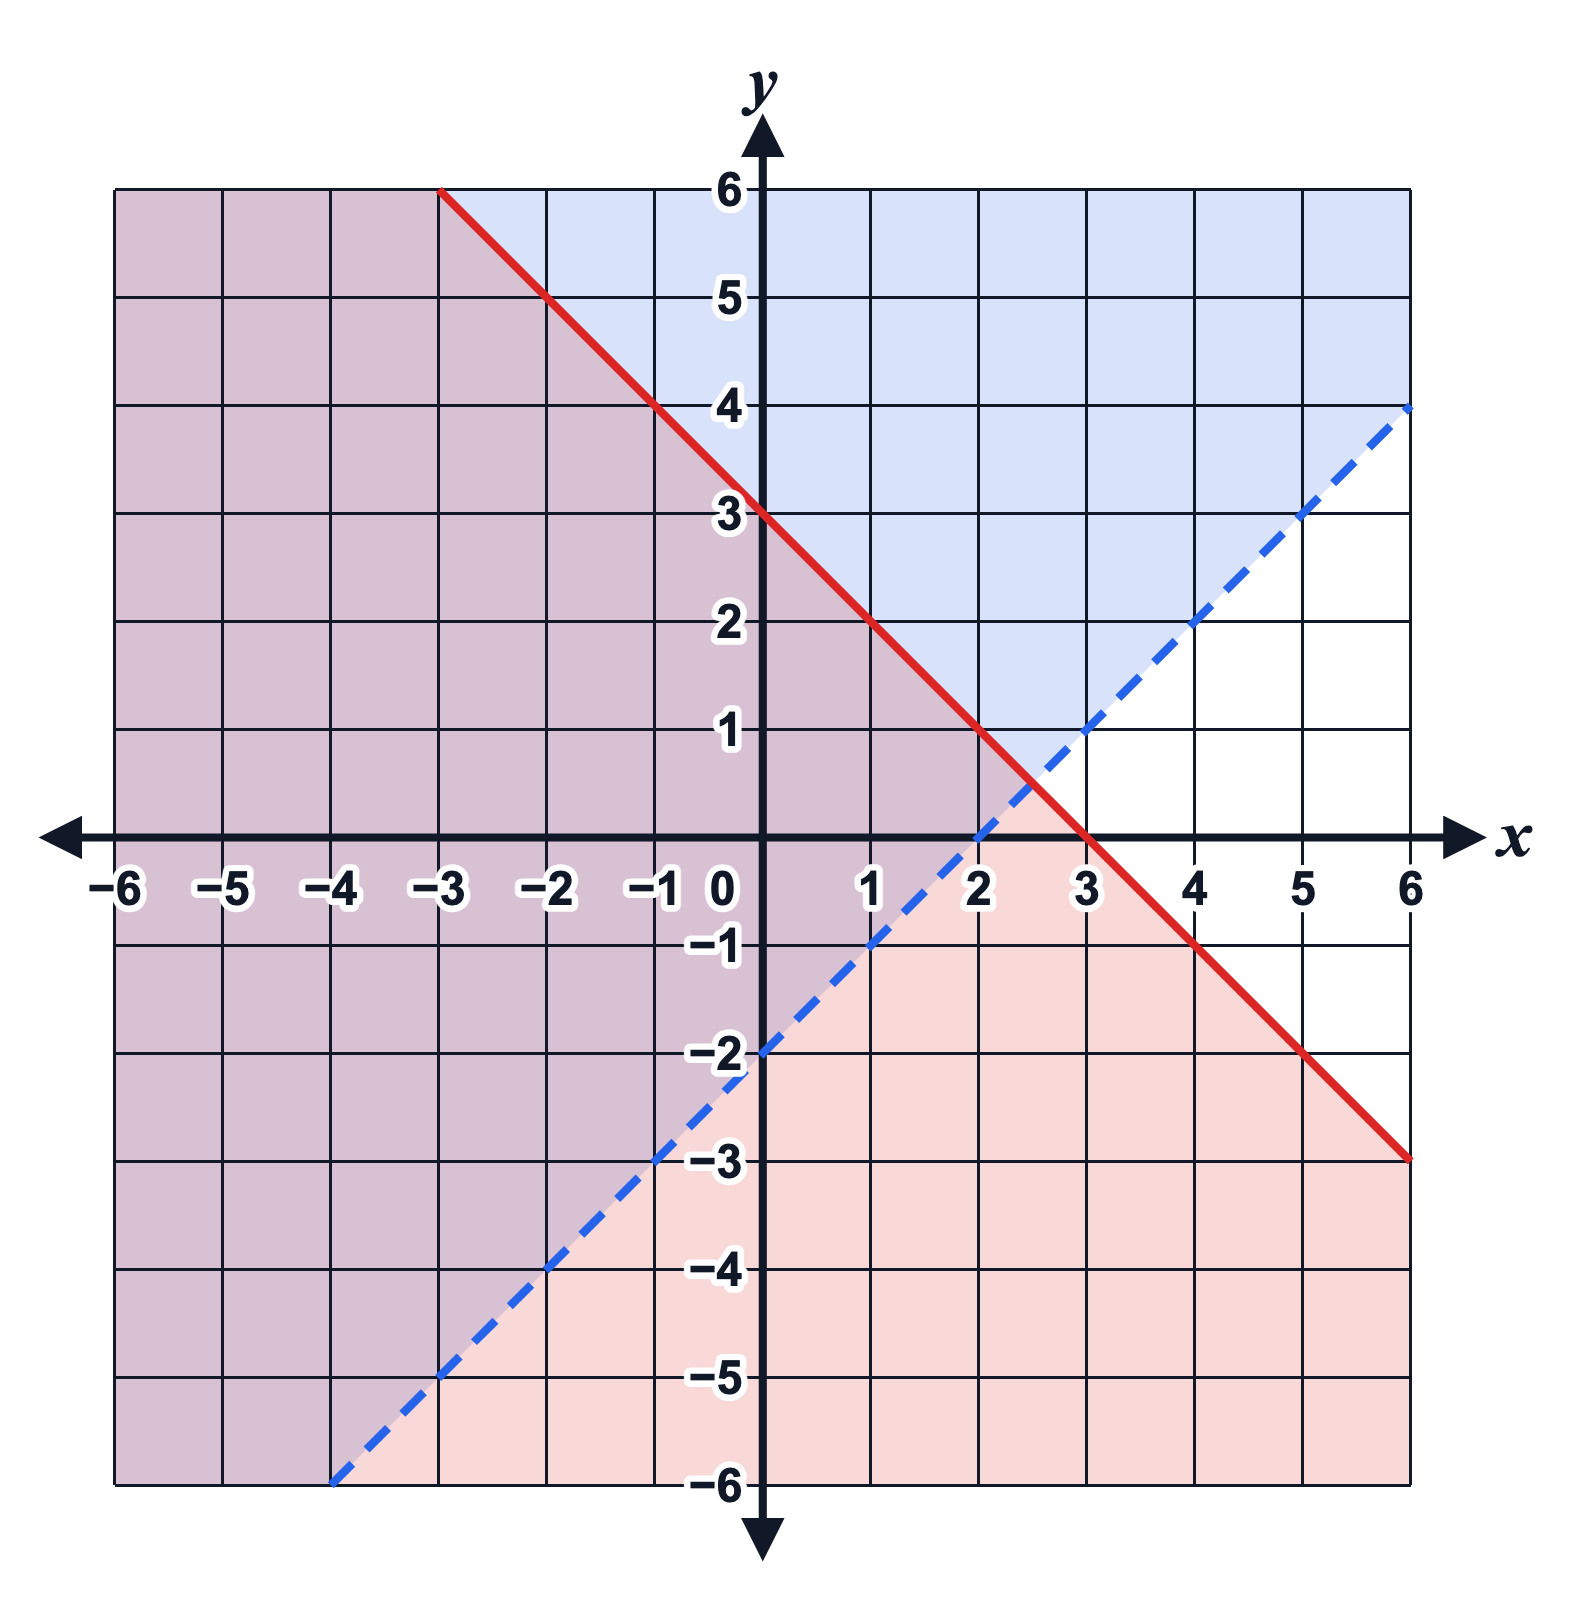 System of linear inequalities: y > x − 2 and y ≤ −x + 3