
Graphs of y = 2ˣ and y = log₂ x, reflected in y = x
An example figure from the Coordinate Grid Generator.
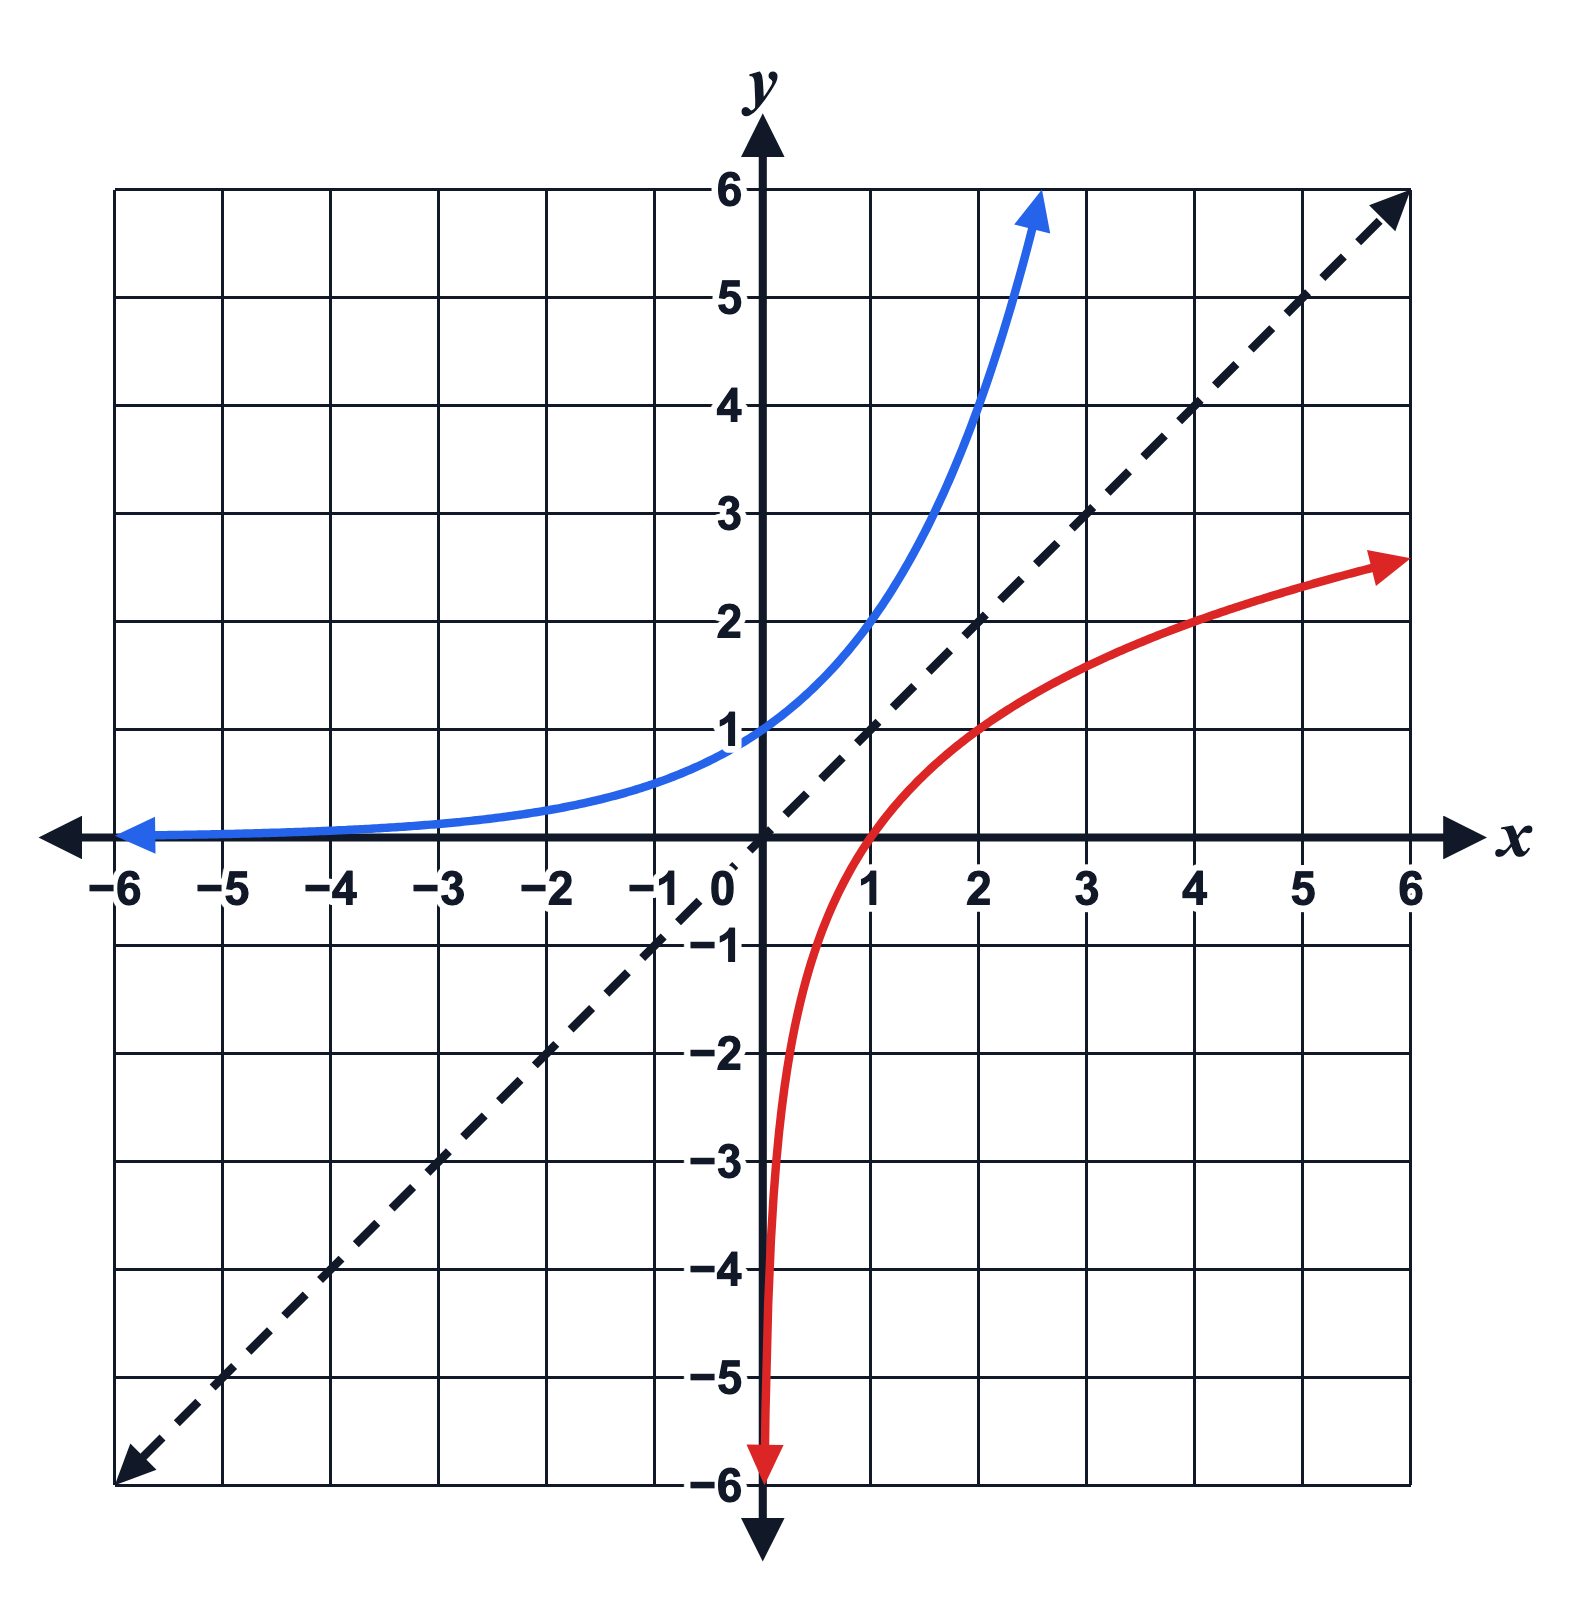
Editing opens it in the Coordinate Grid Generator with these settings, to change anything and copy or download your own.
Answer key
- y = 2^x
- y = log_2(x)
- y = x: slope 1, y-intercept 0
Free to use in your tests, worksheets, slides or anything else, no credit needed. Public domain under CC0 1.0. How to reuse our figures
More Coordinate Grid examples
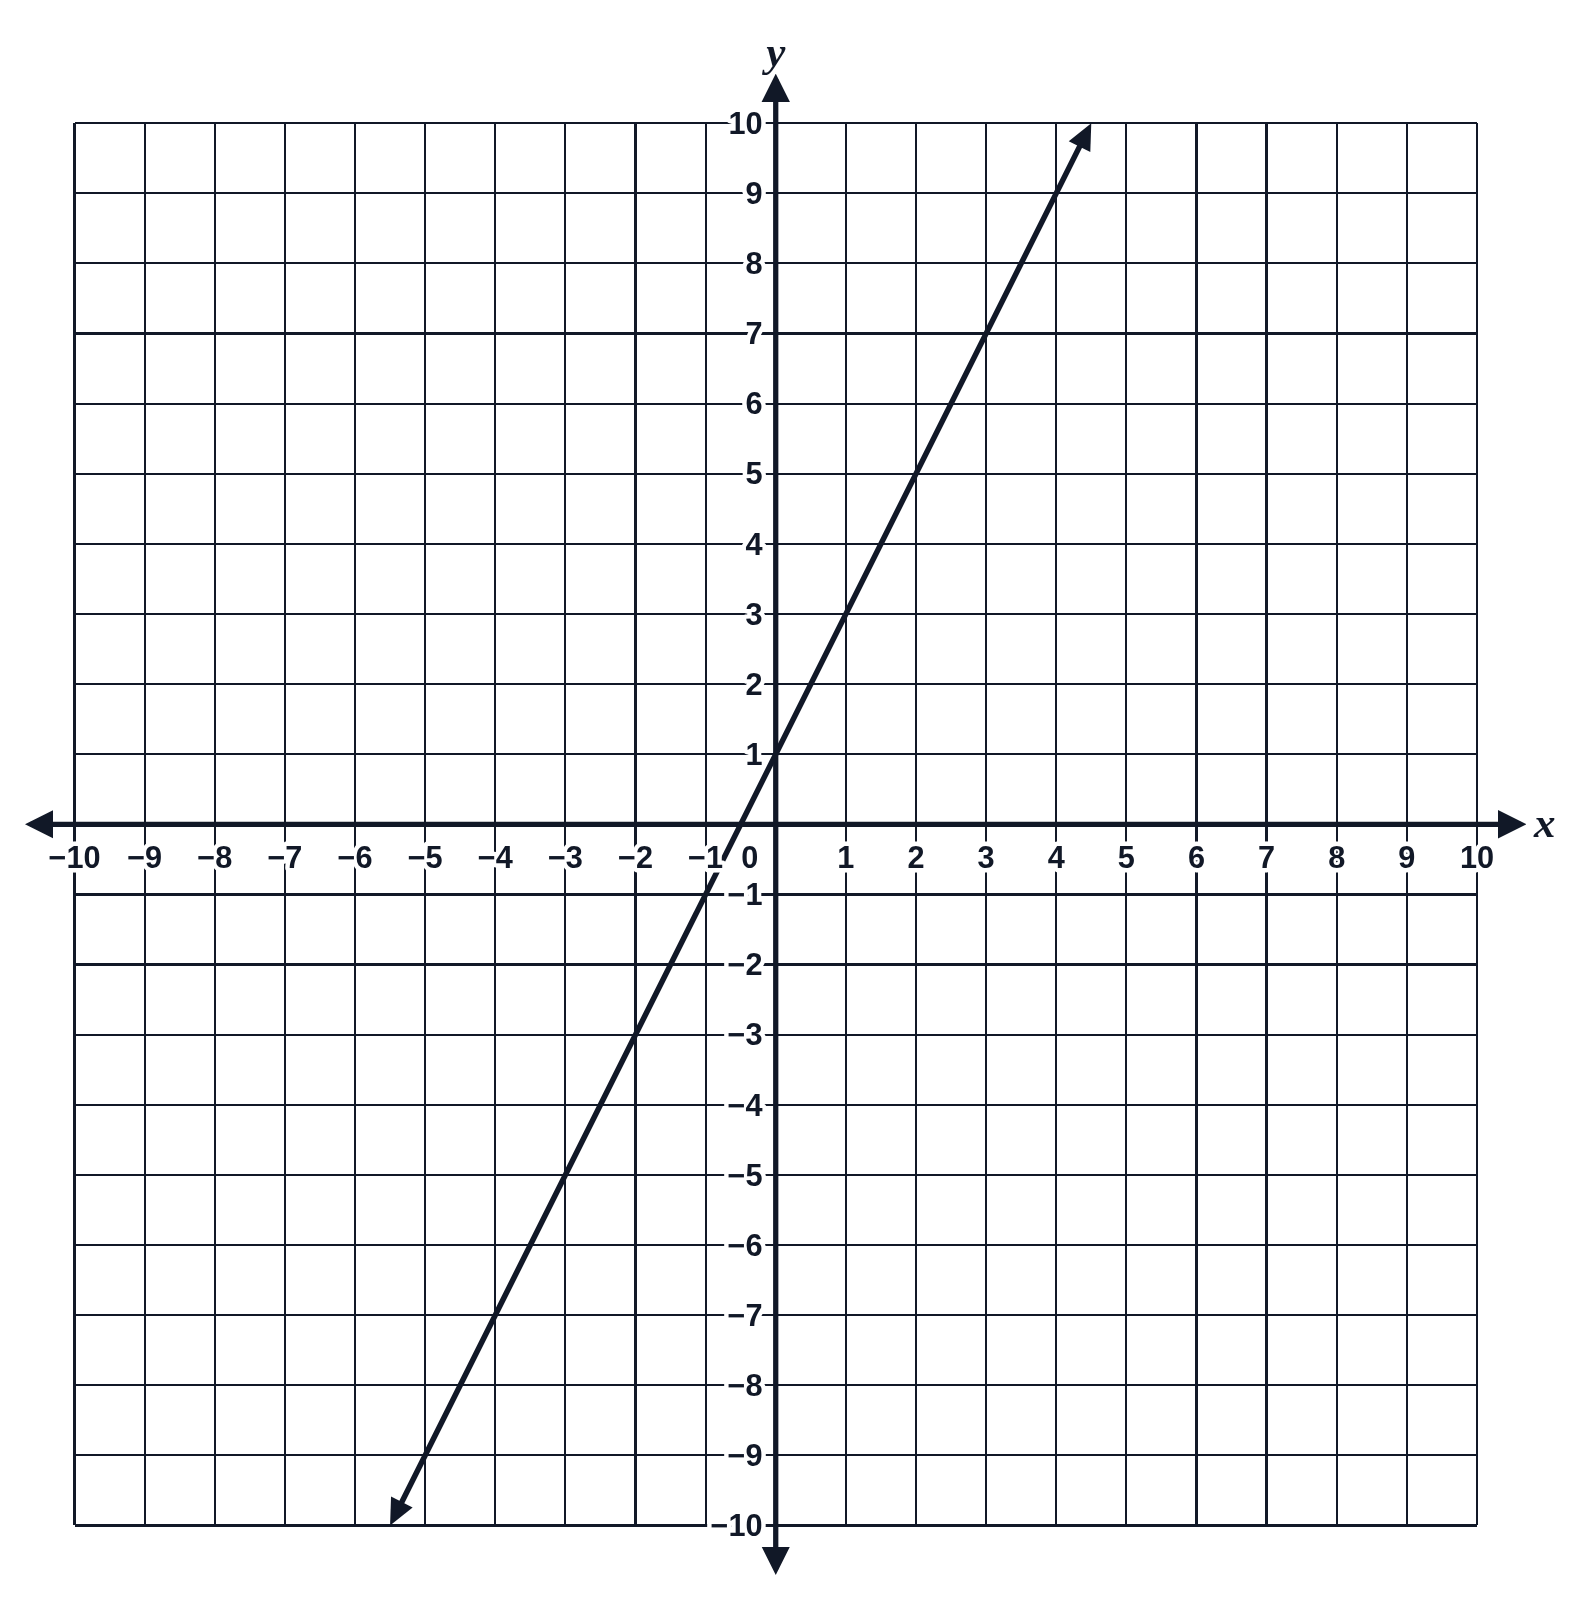 Graph of y = 2x + 1 on a coordinate plane
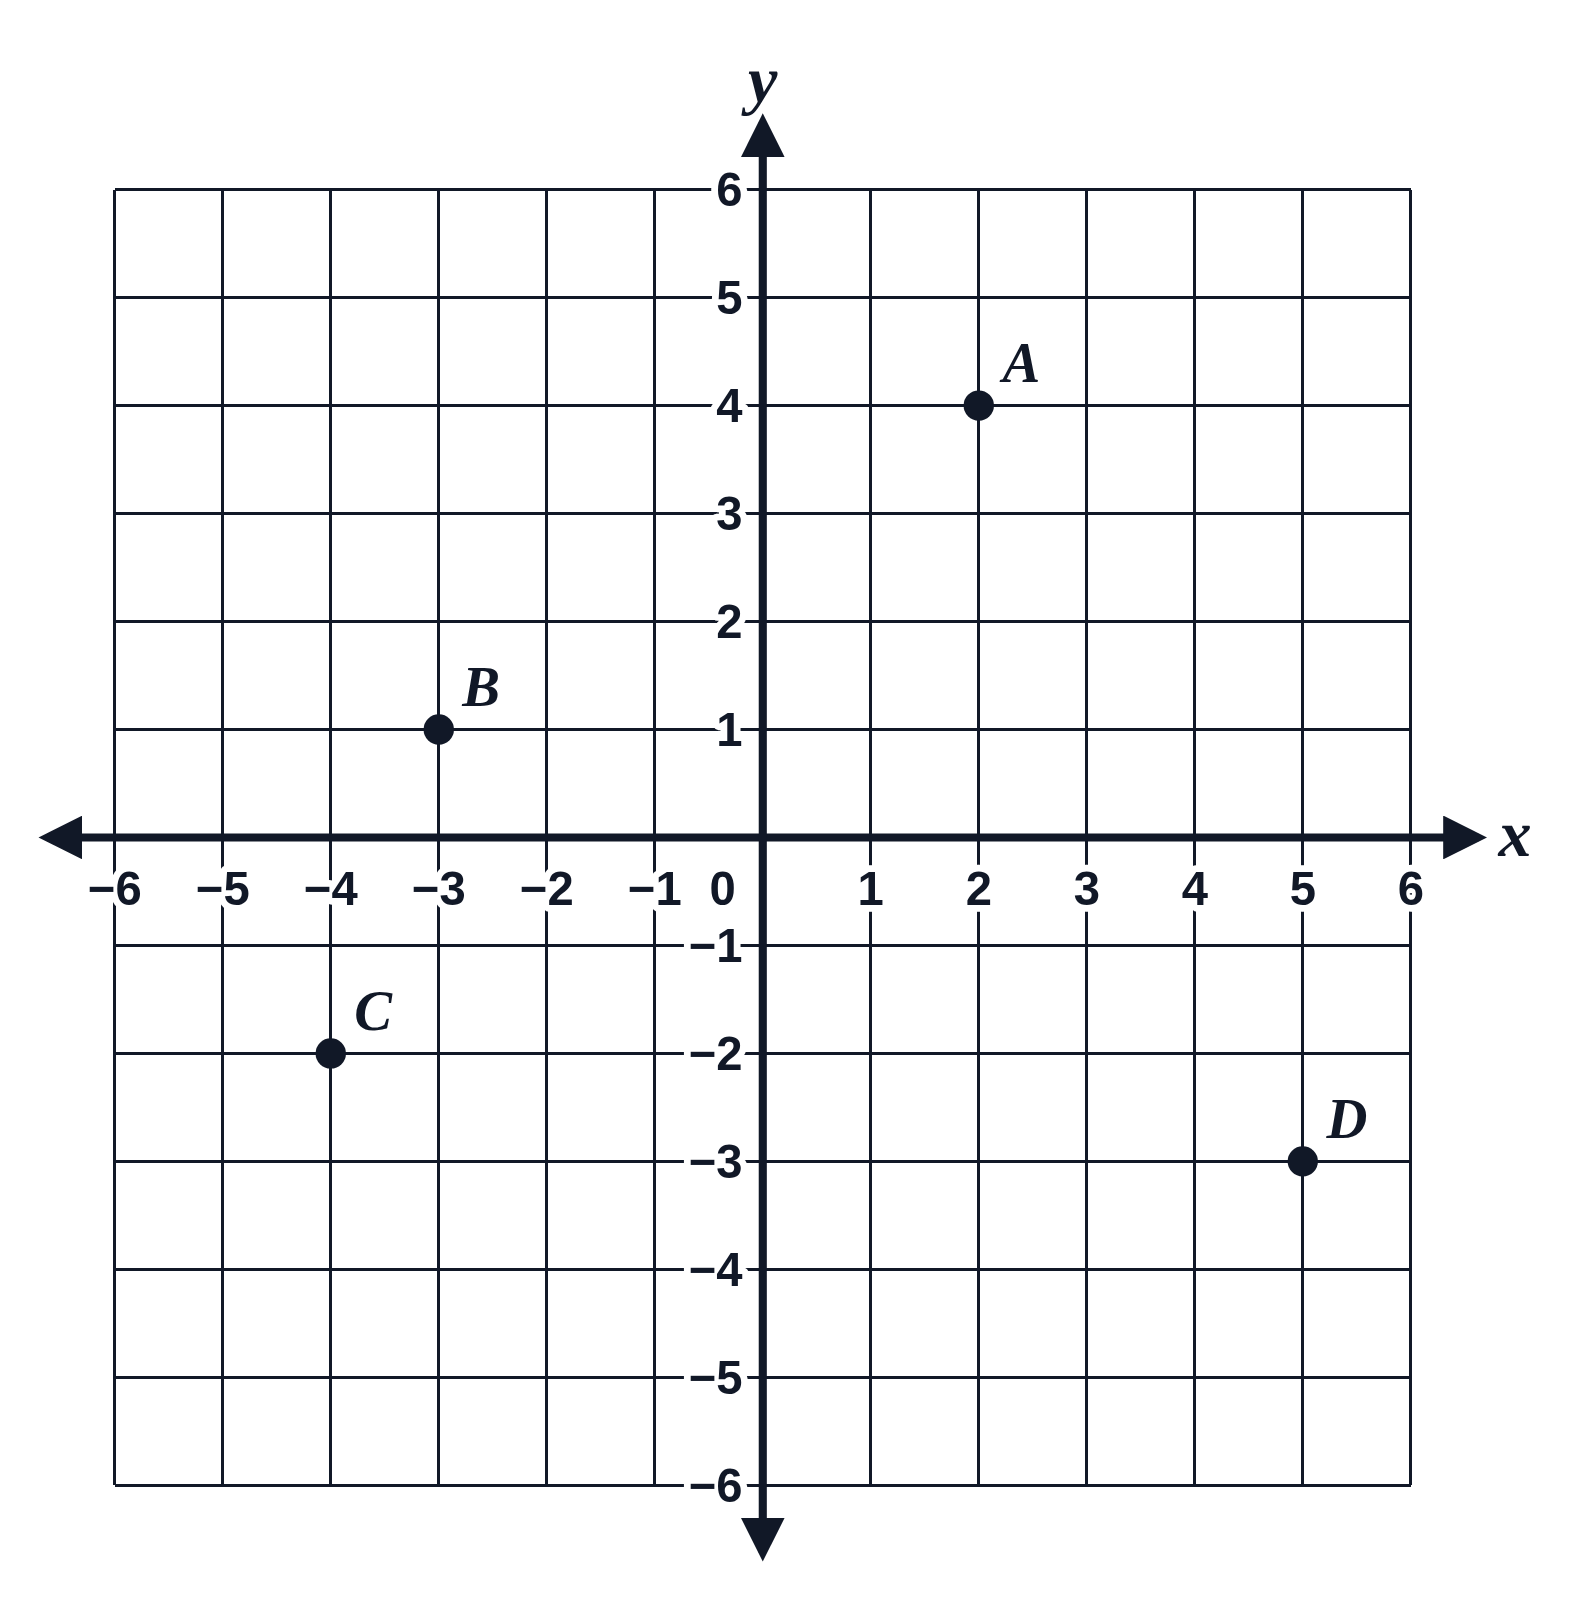 Plotting points in all four quadrants
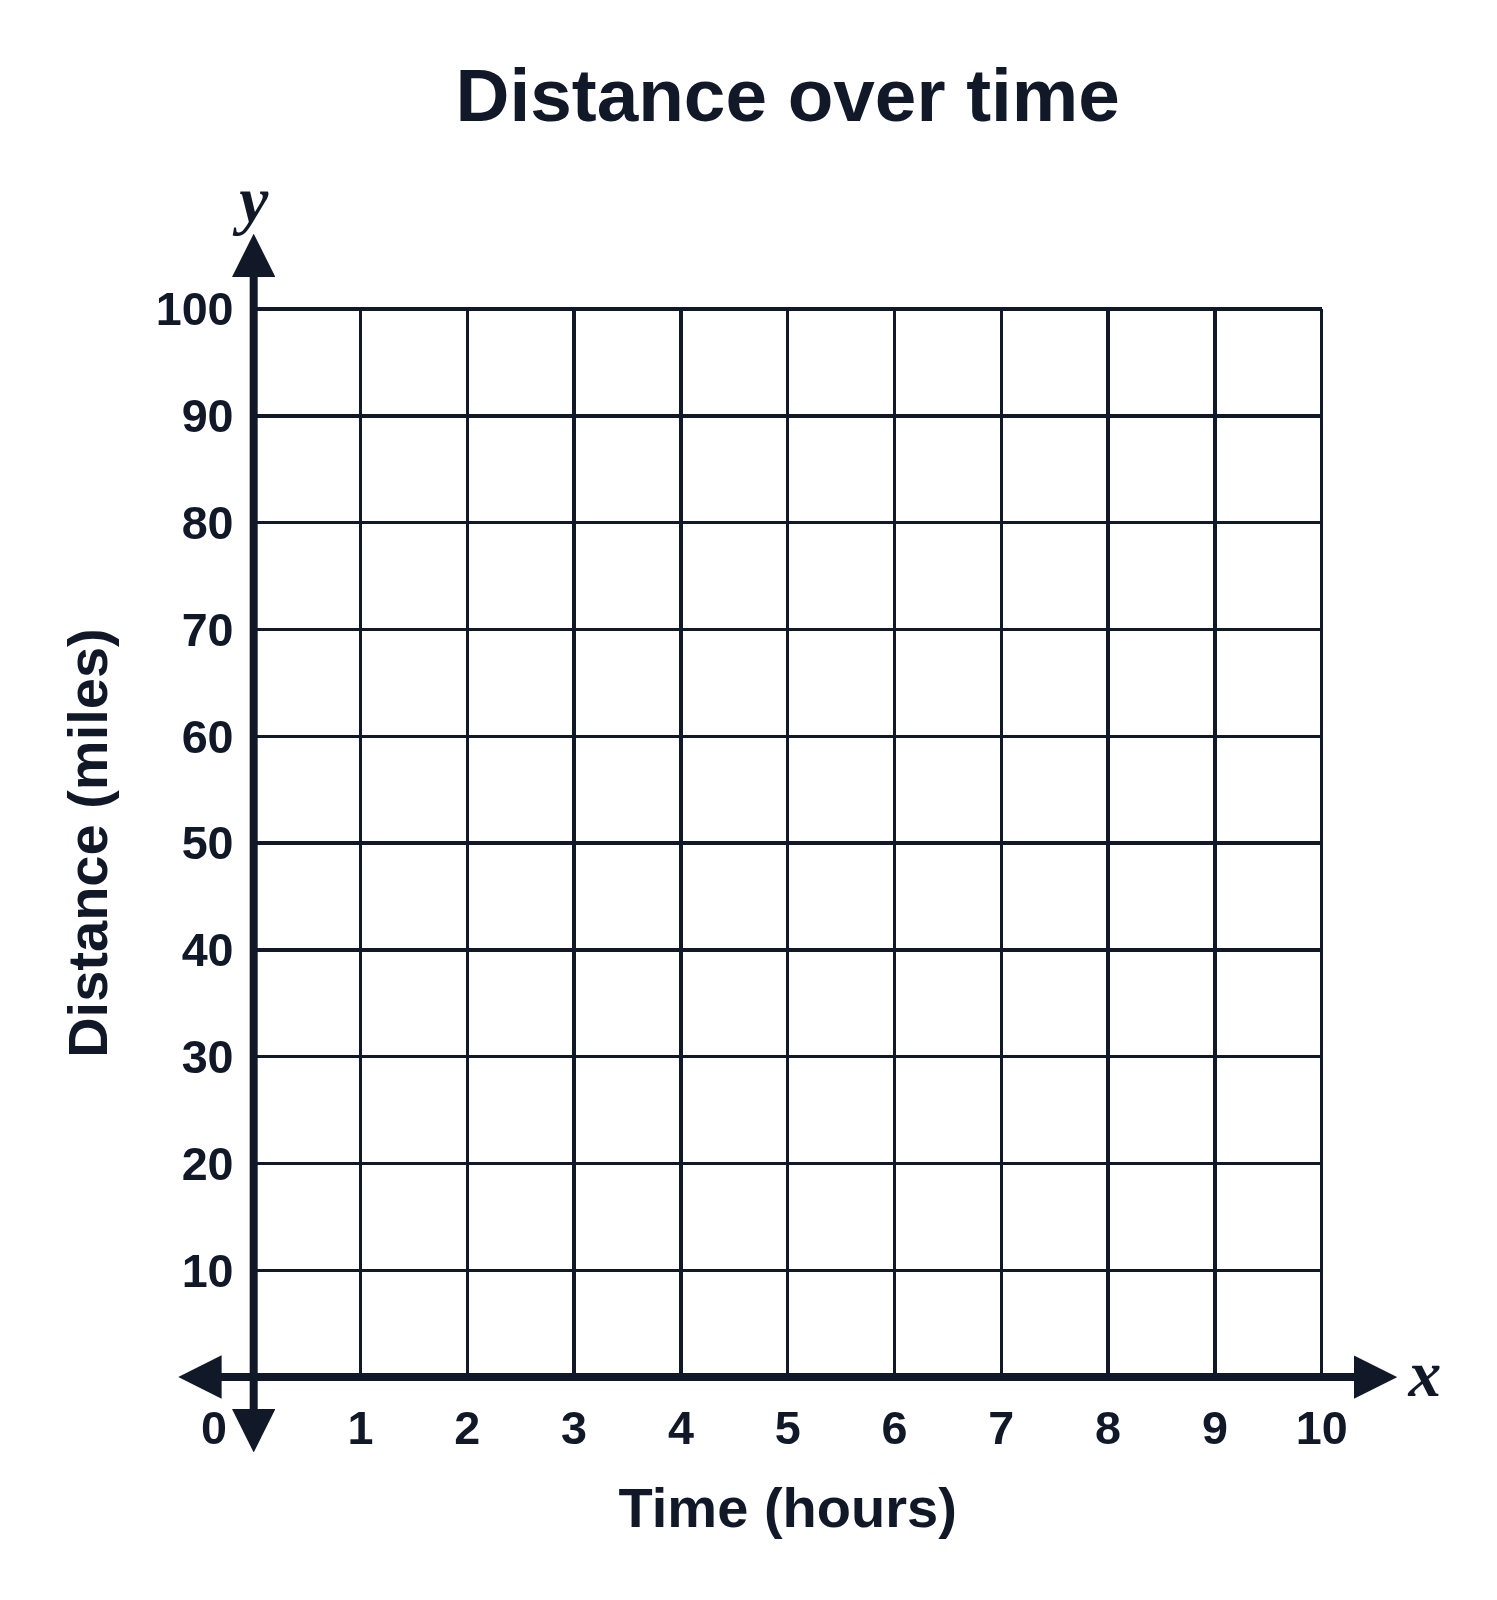 First-quadrant graph with axis titles: distance over time
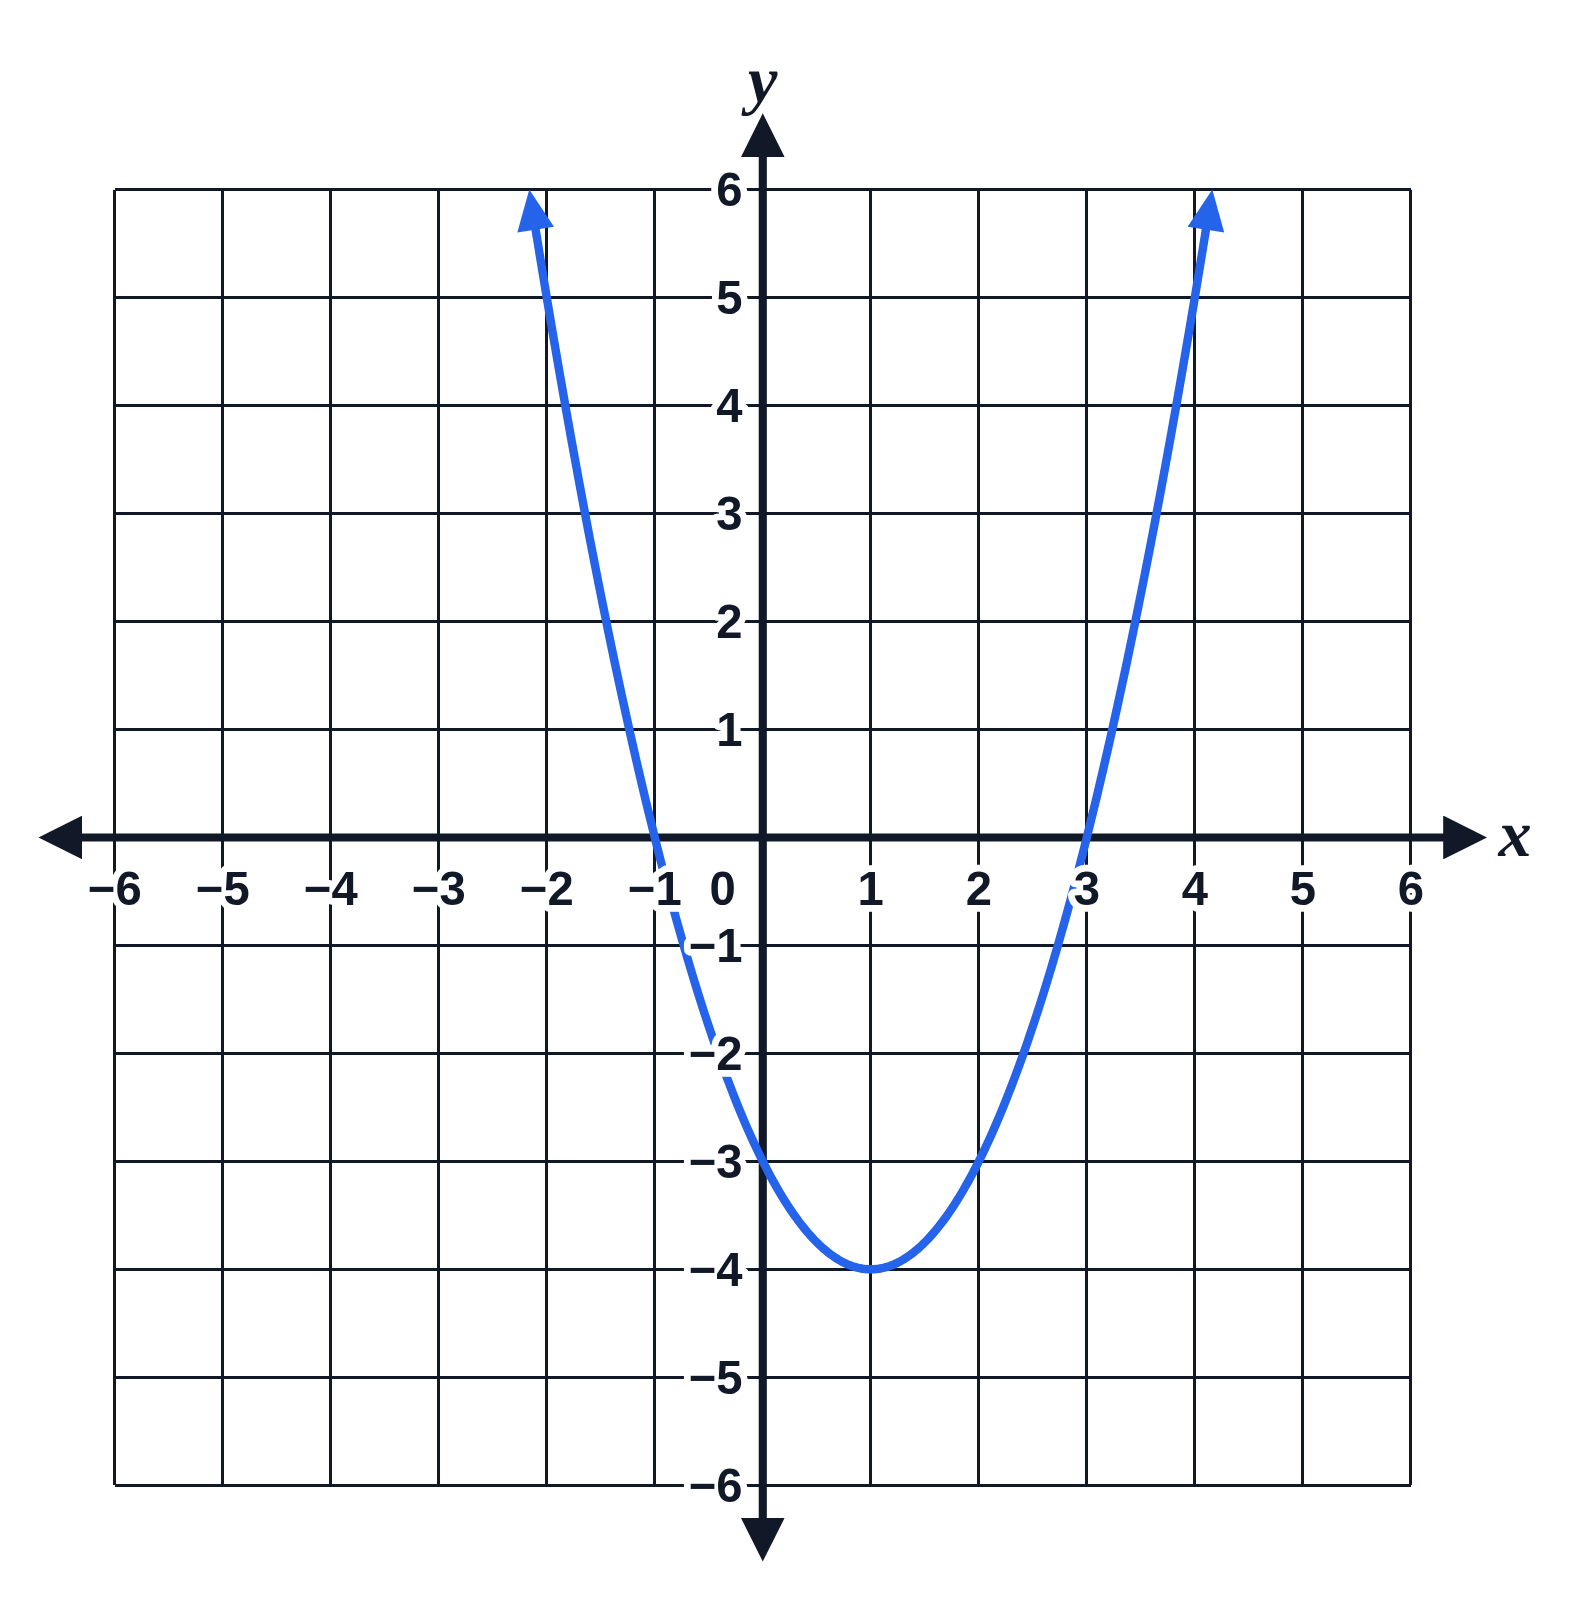 Graph of the parabola y = x² − 2x − 3
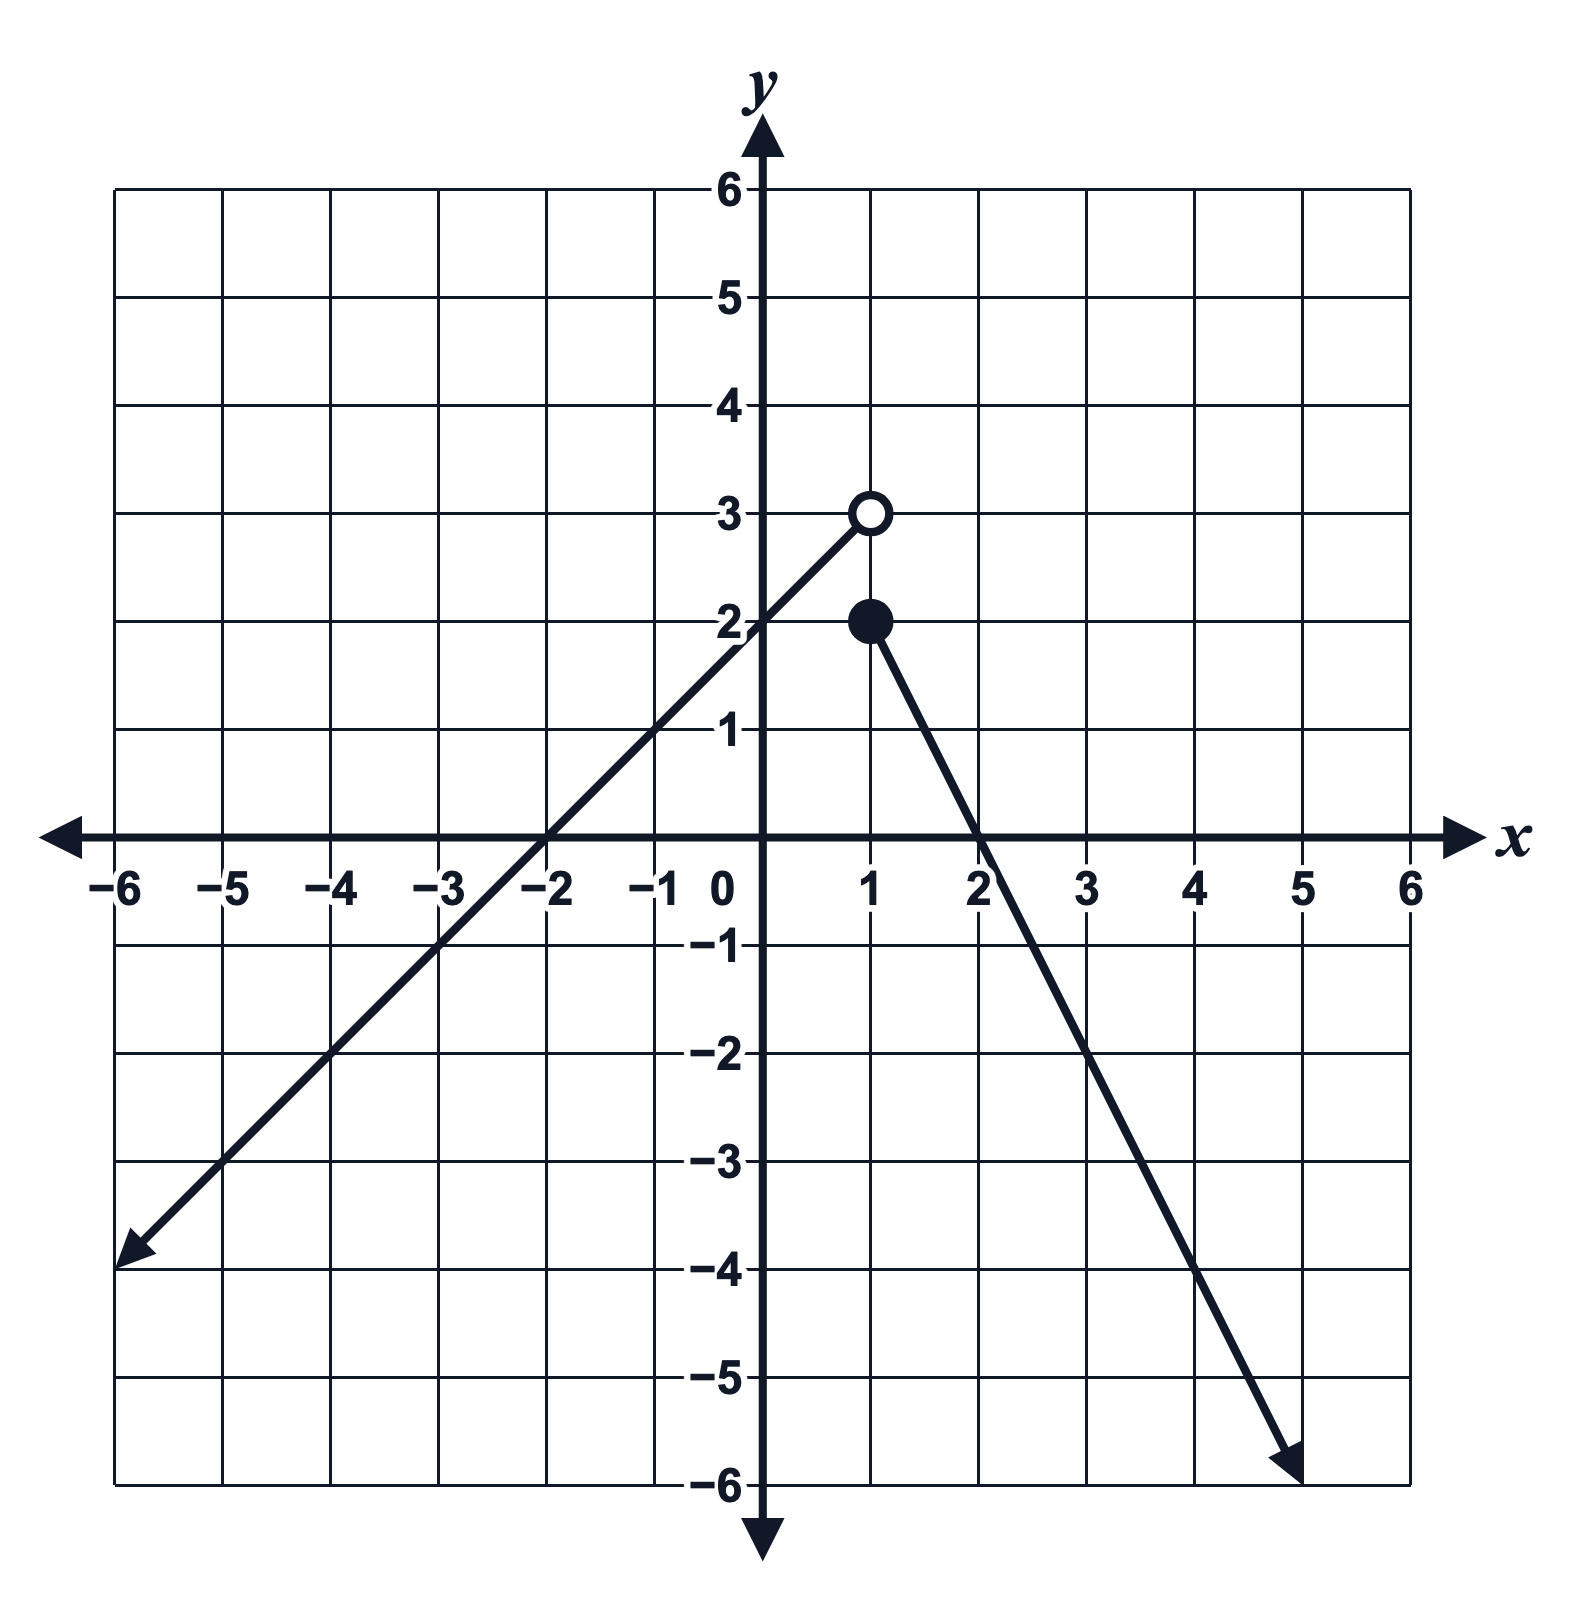 Piecewise function graph with open and closed circles
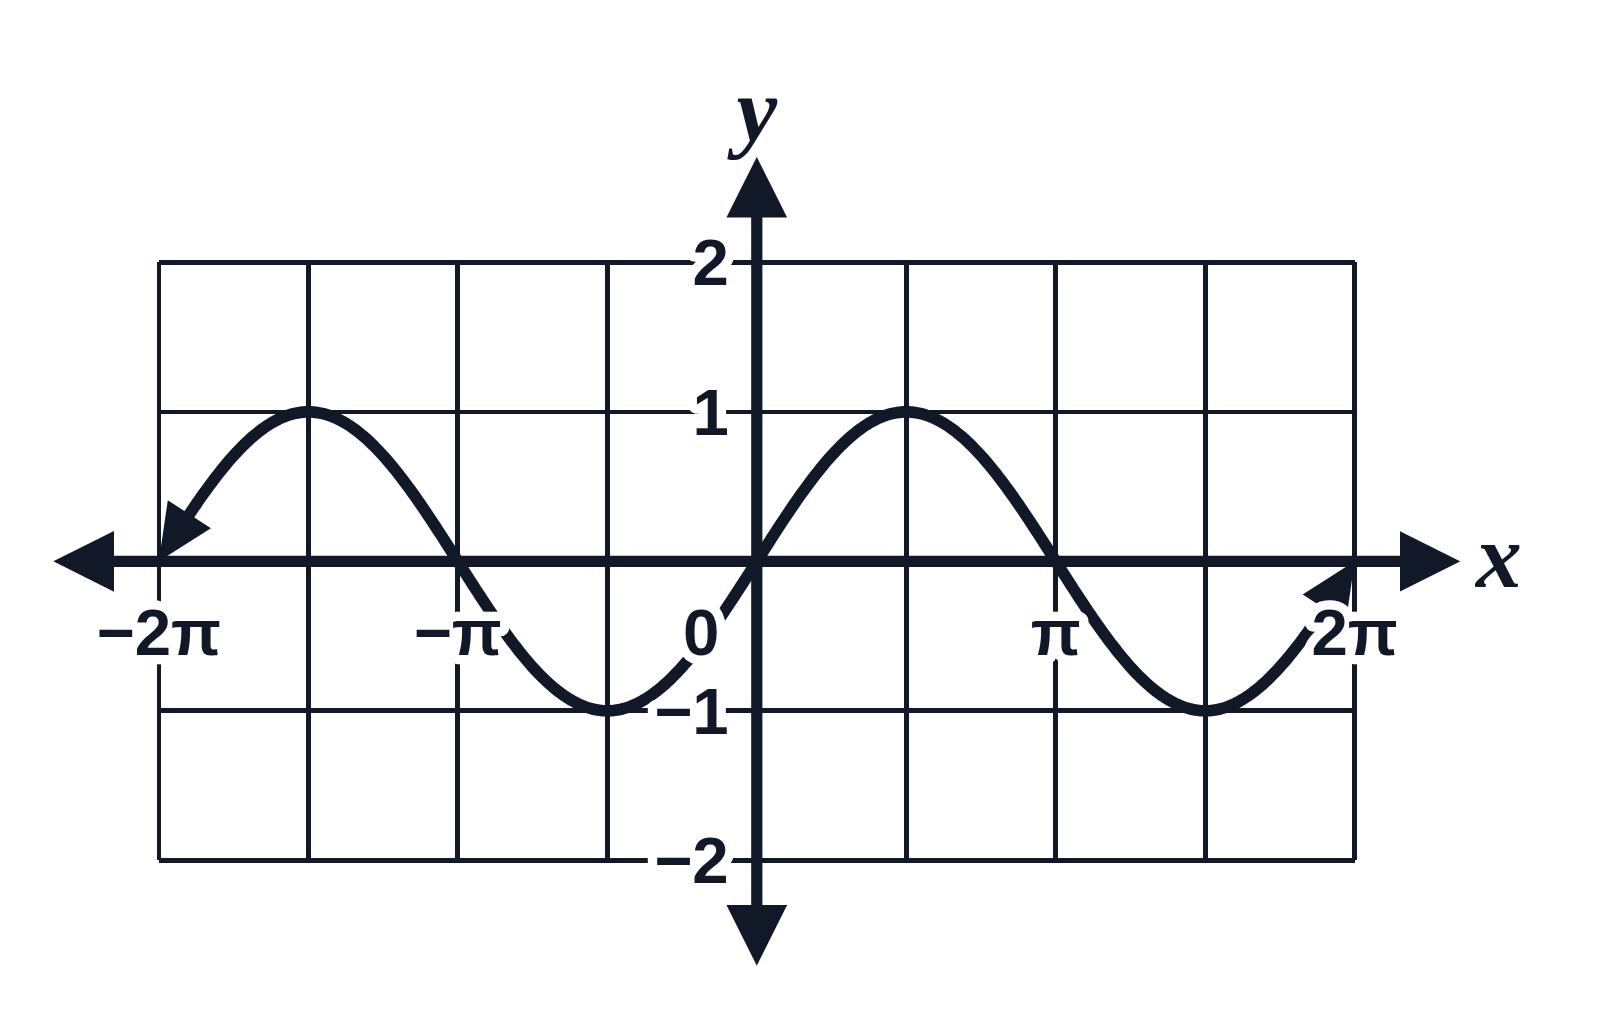 Graph of y = sin x from −2π to 2π
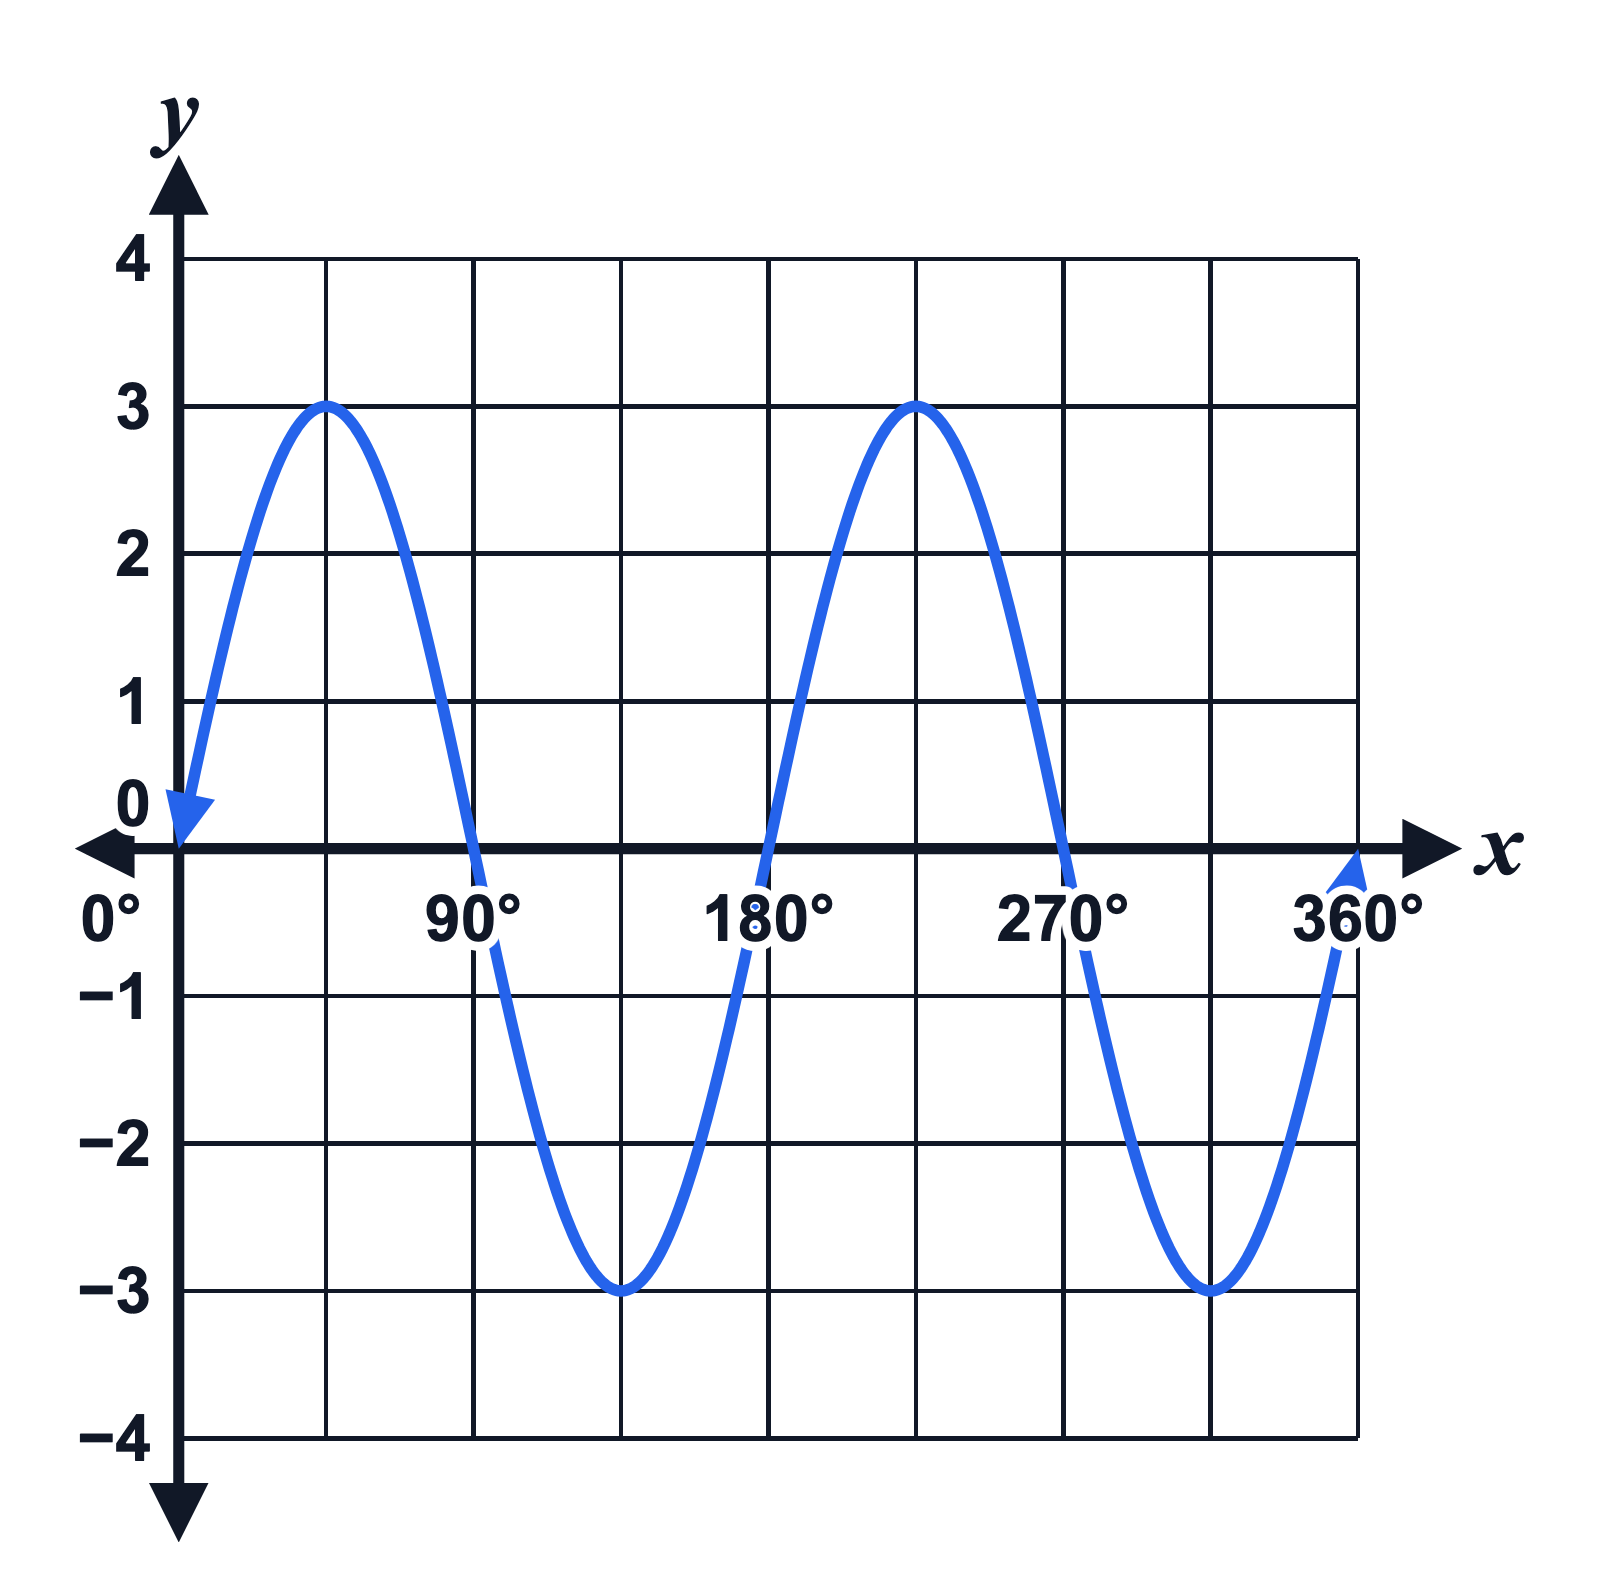 Graph of y = 3 sin 2x in degrees, from 0° to 360°
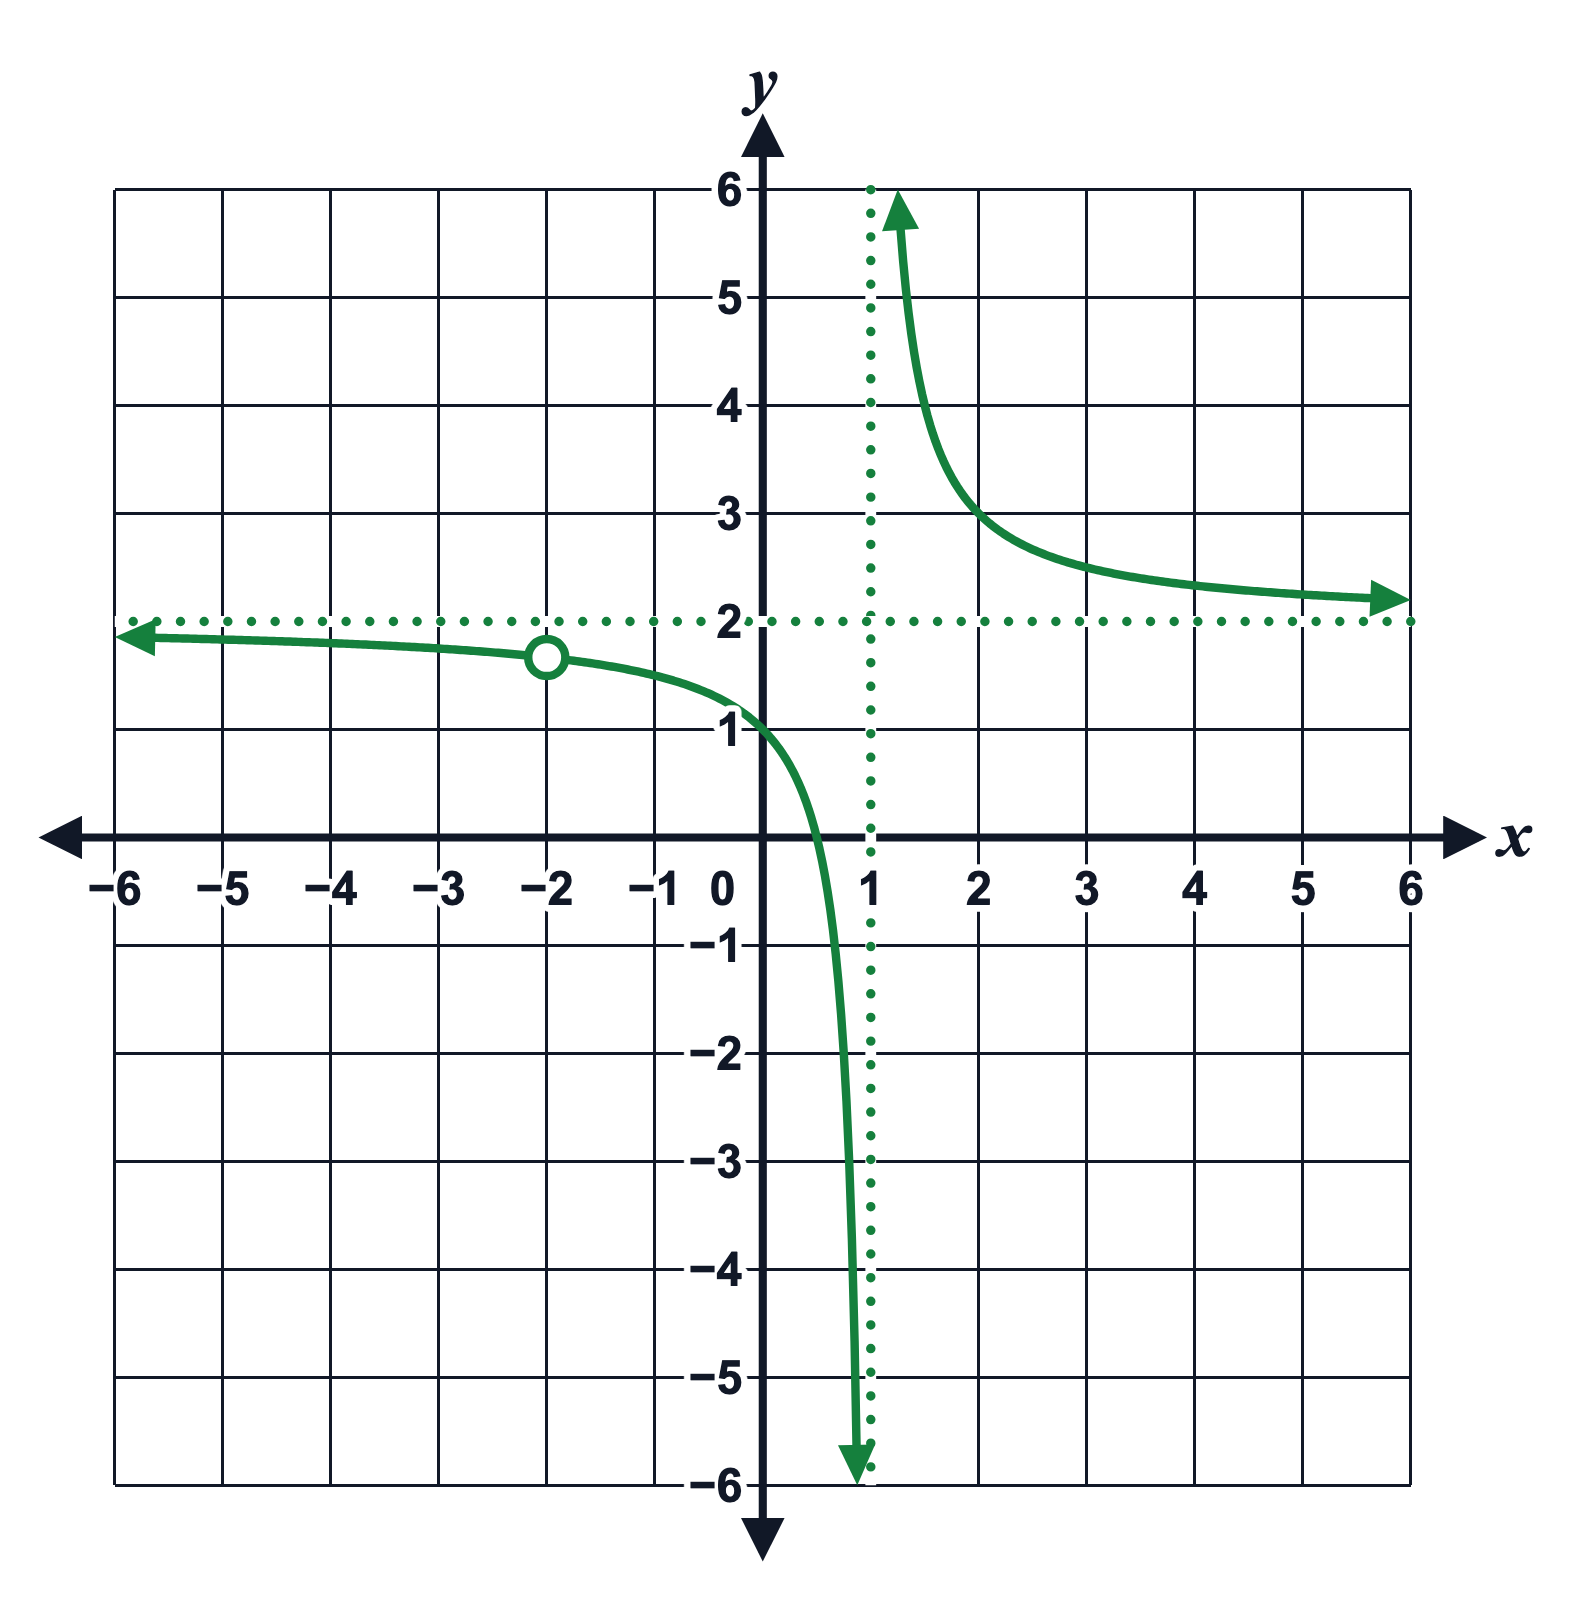 Rational function with a hole and dotted asymptotes
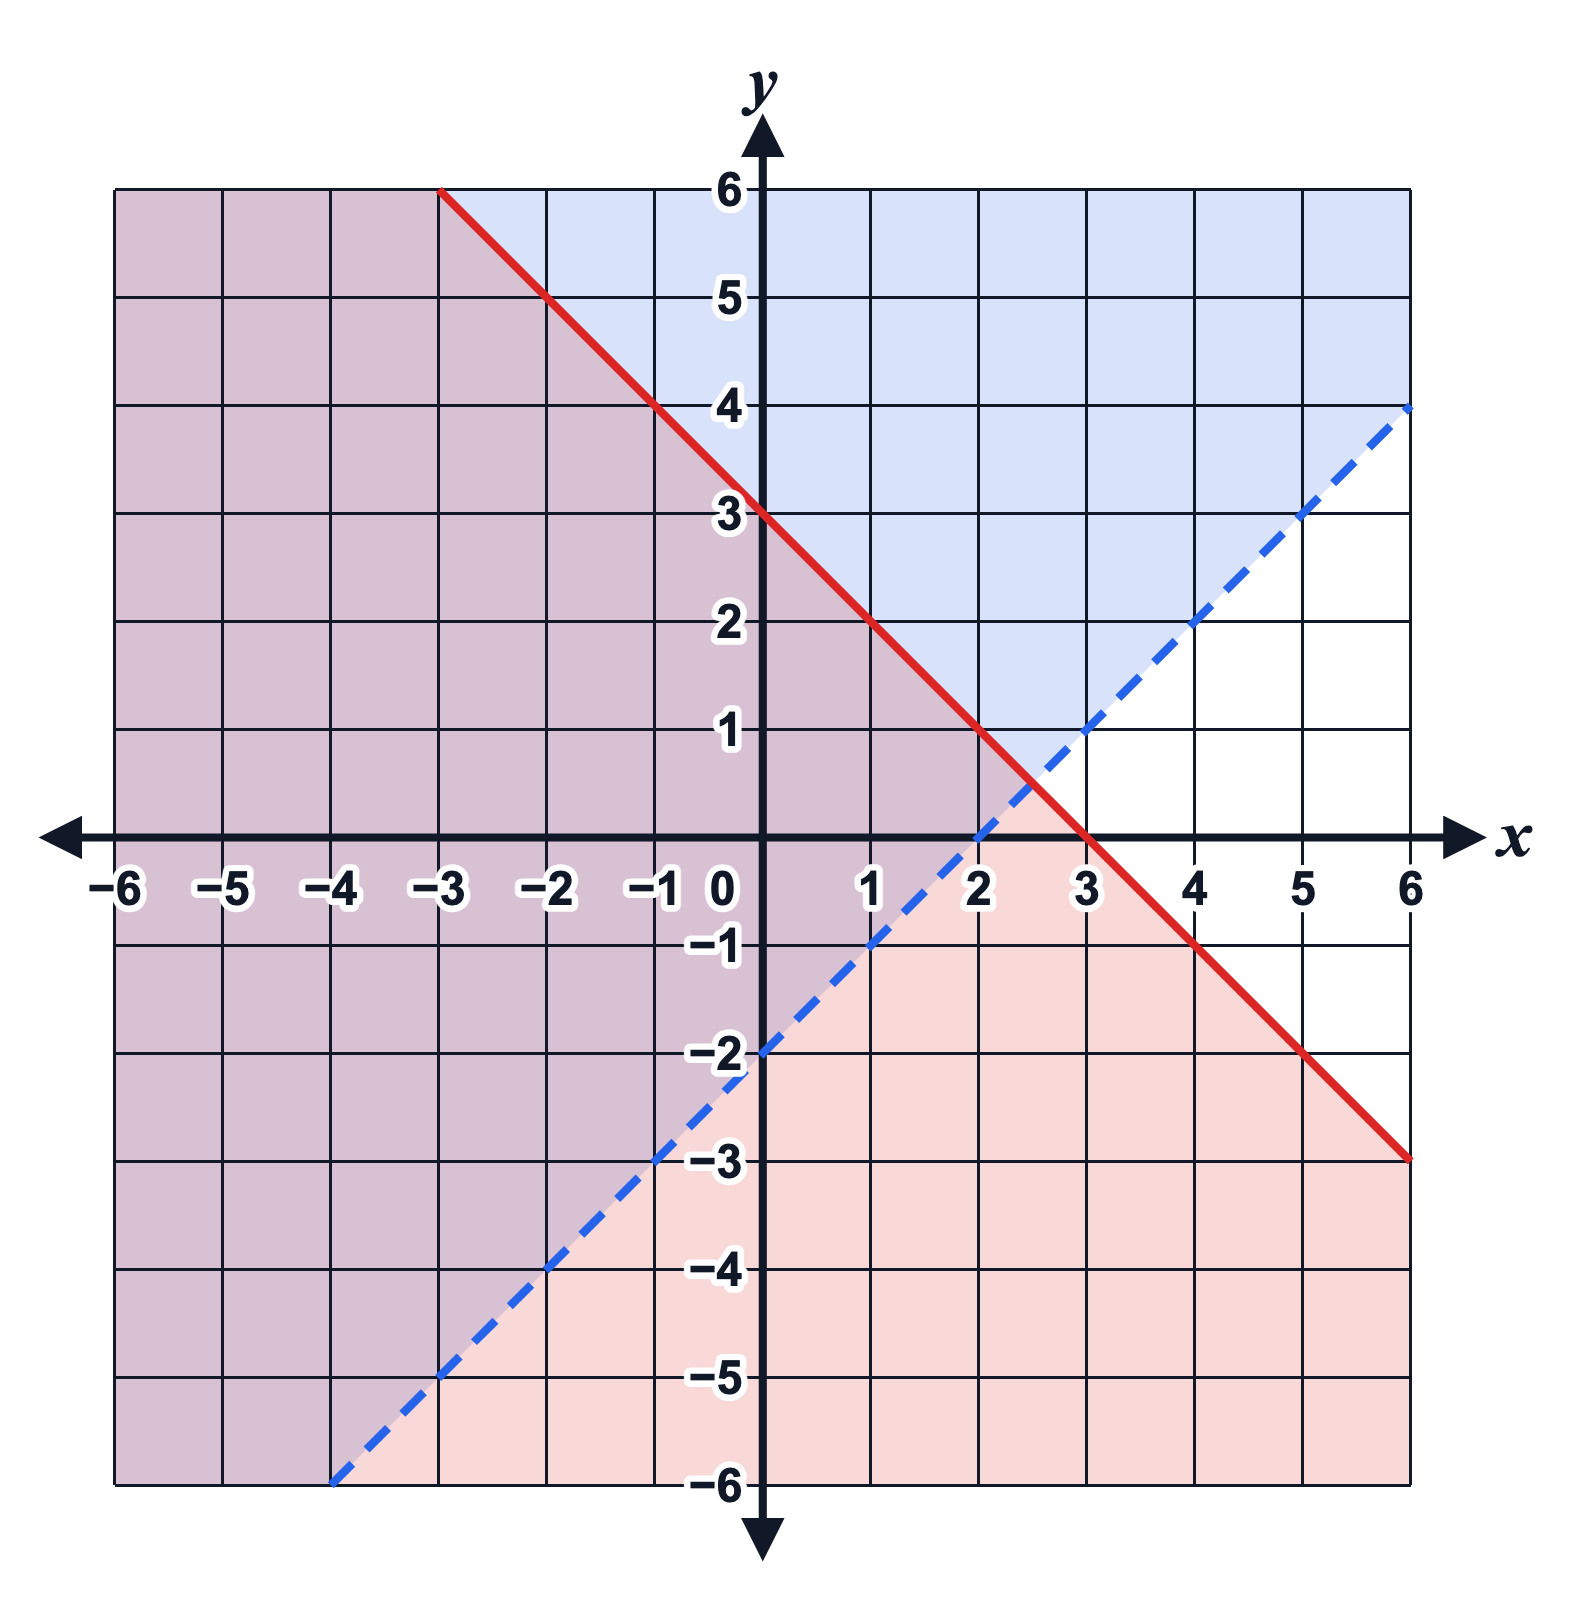 System of linear inequalities: y > x − 2 and y ≤ −x + 3