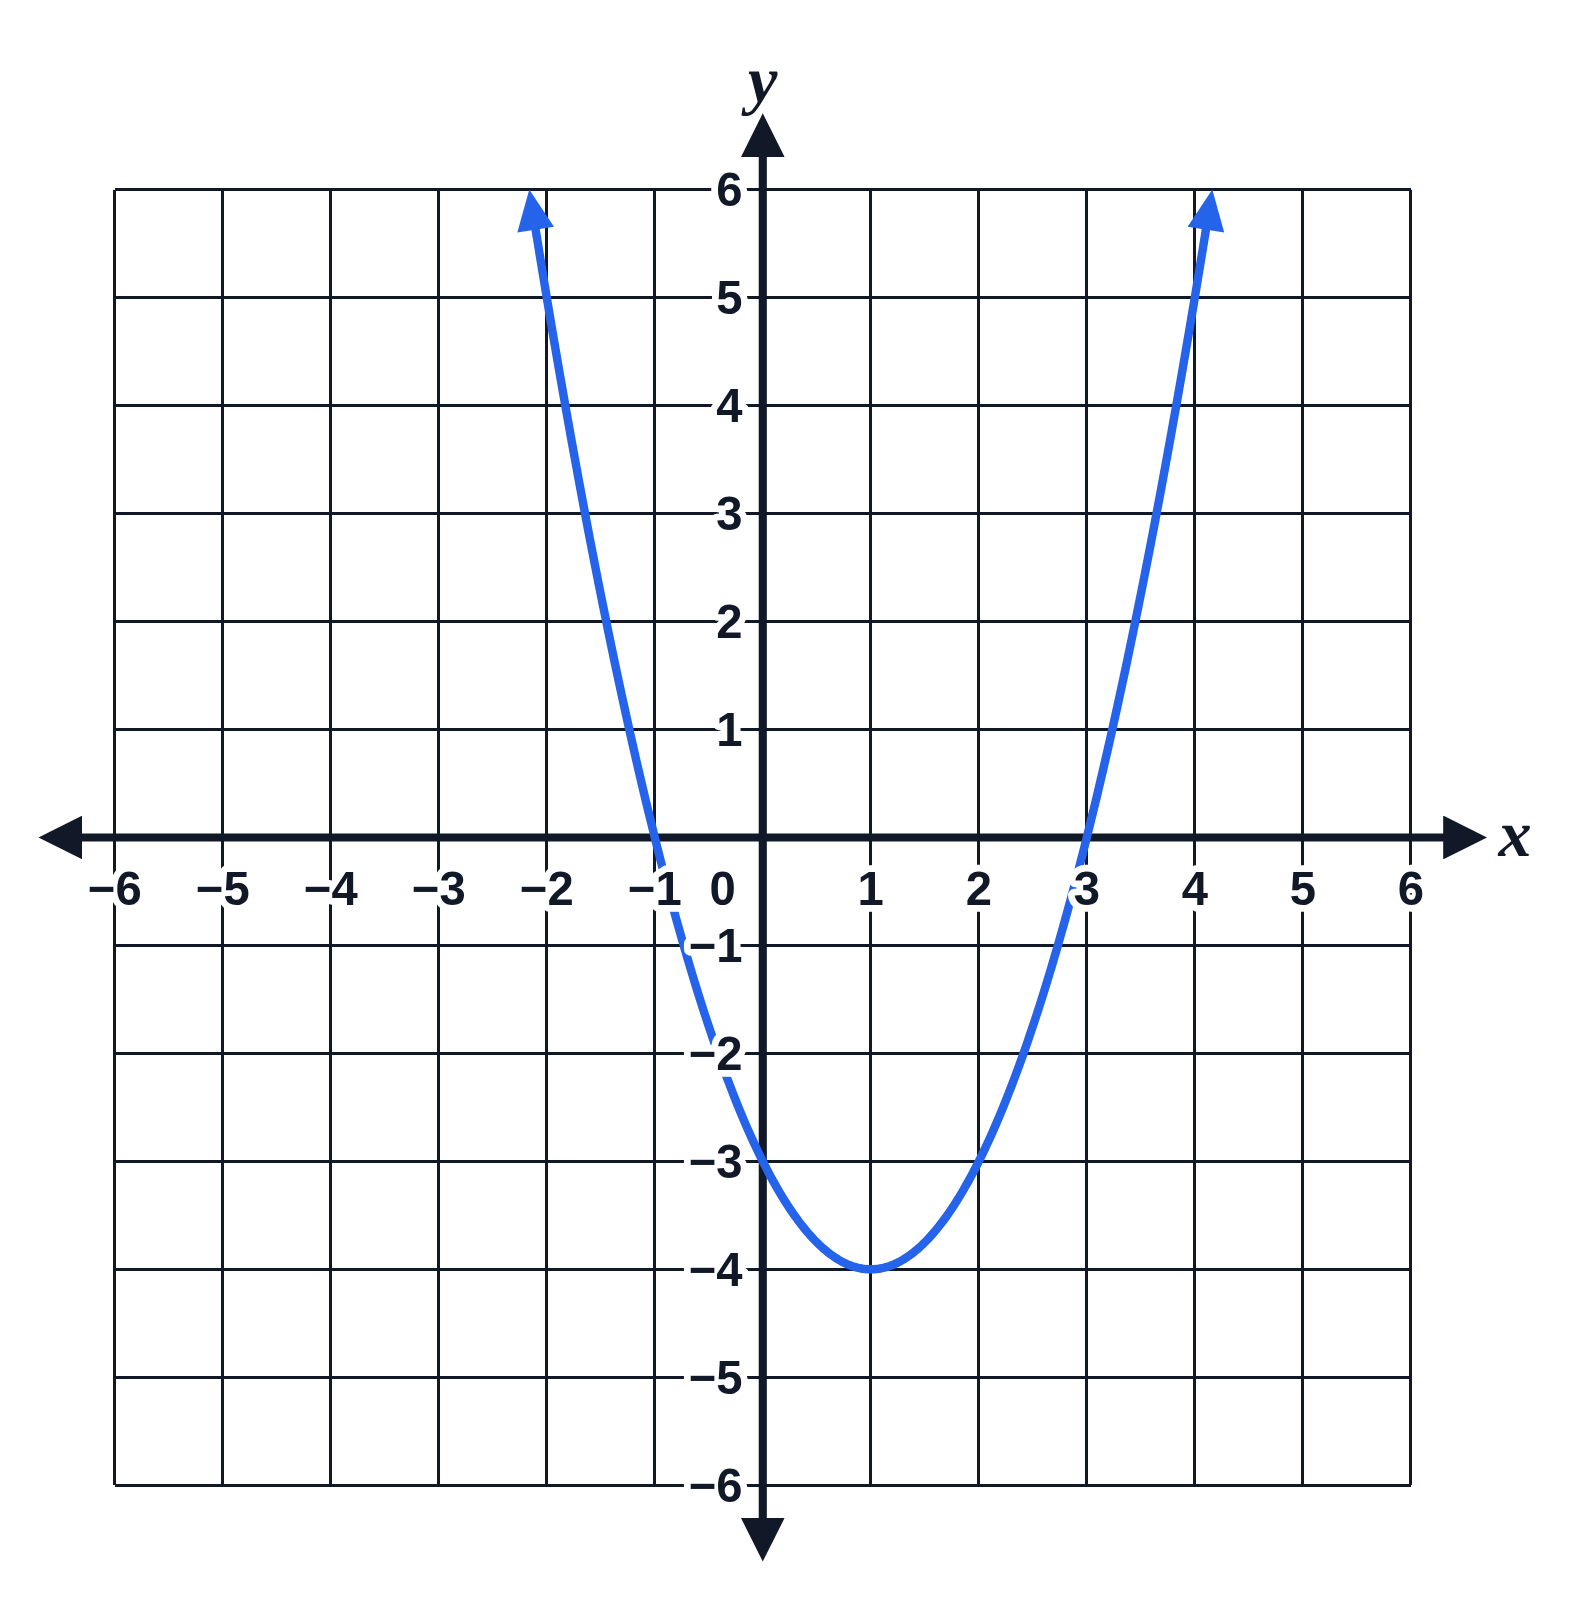
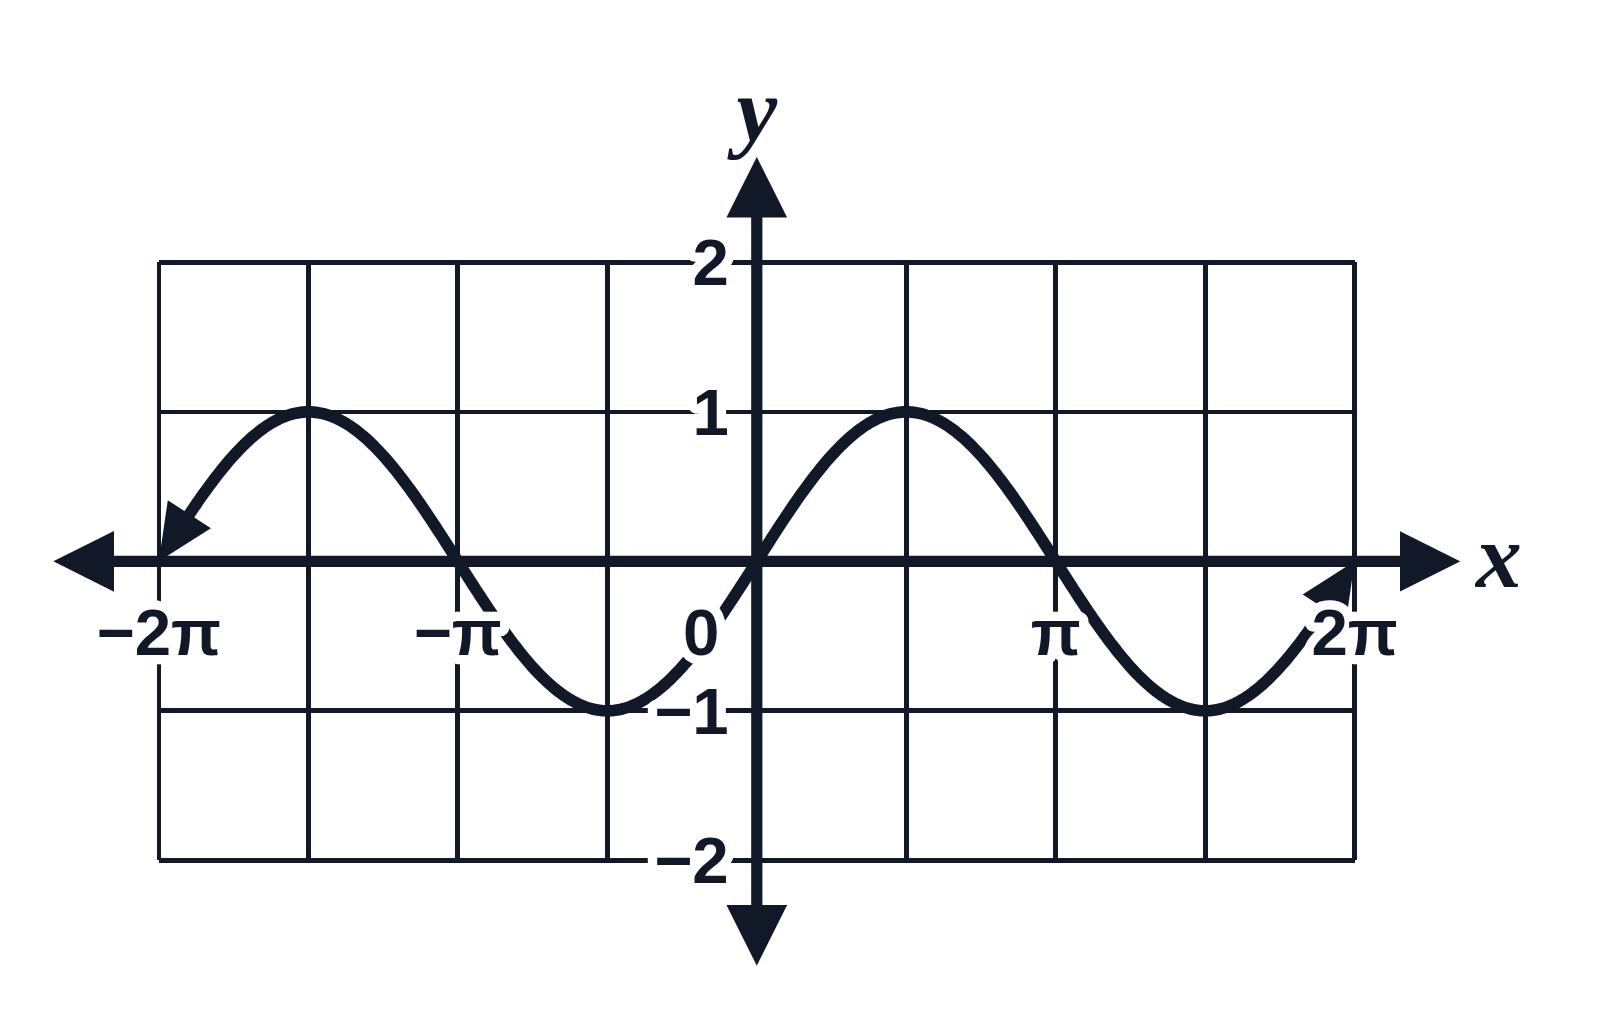
First-quadrant graph with axis titles: distance over time

An example figure from the Coordinate Grid Generator.
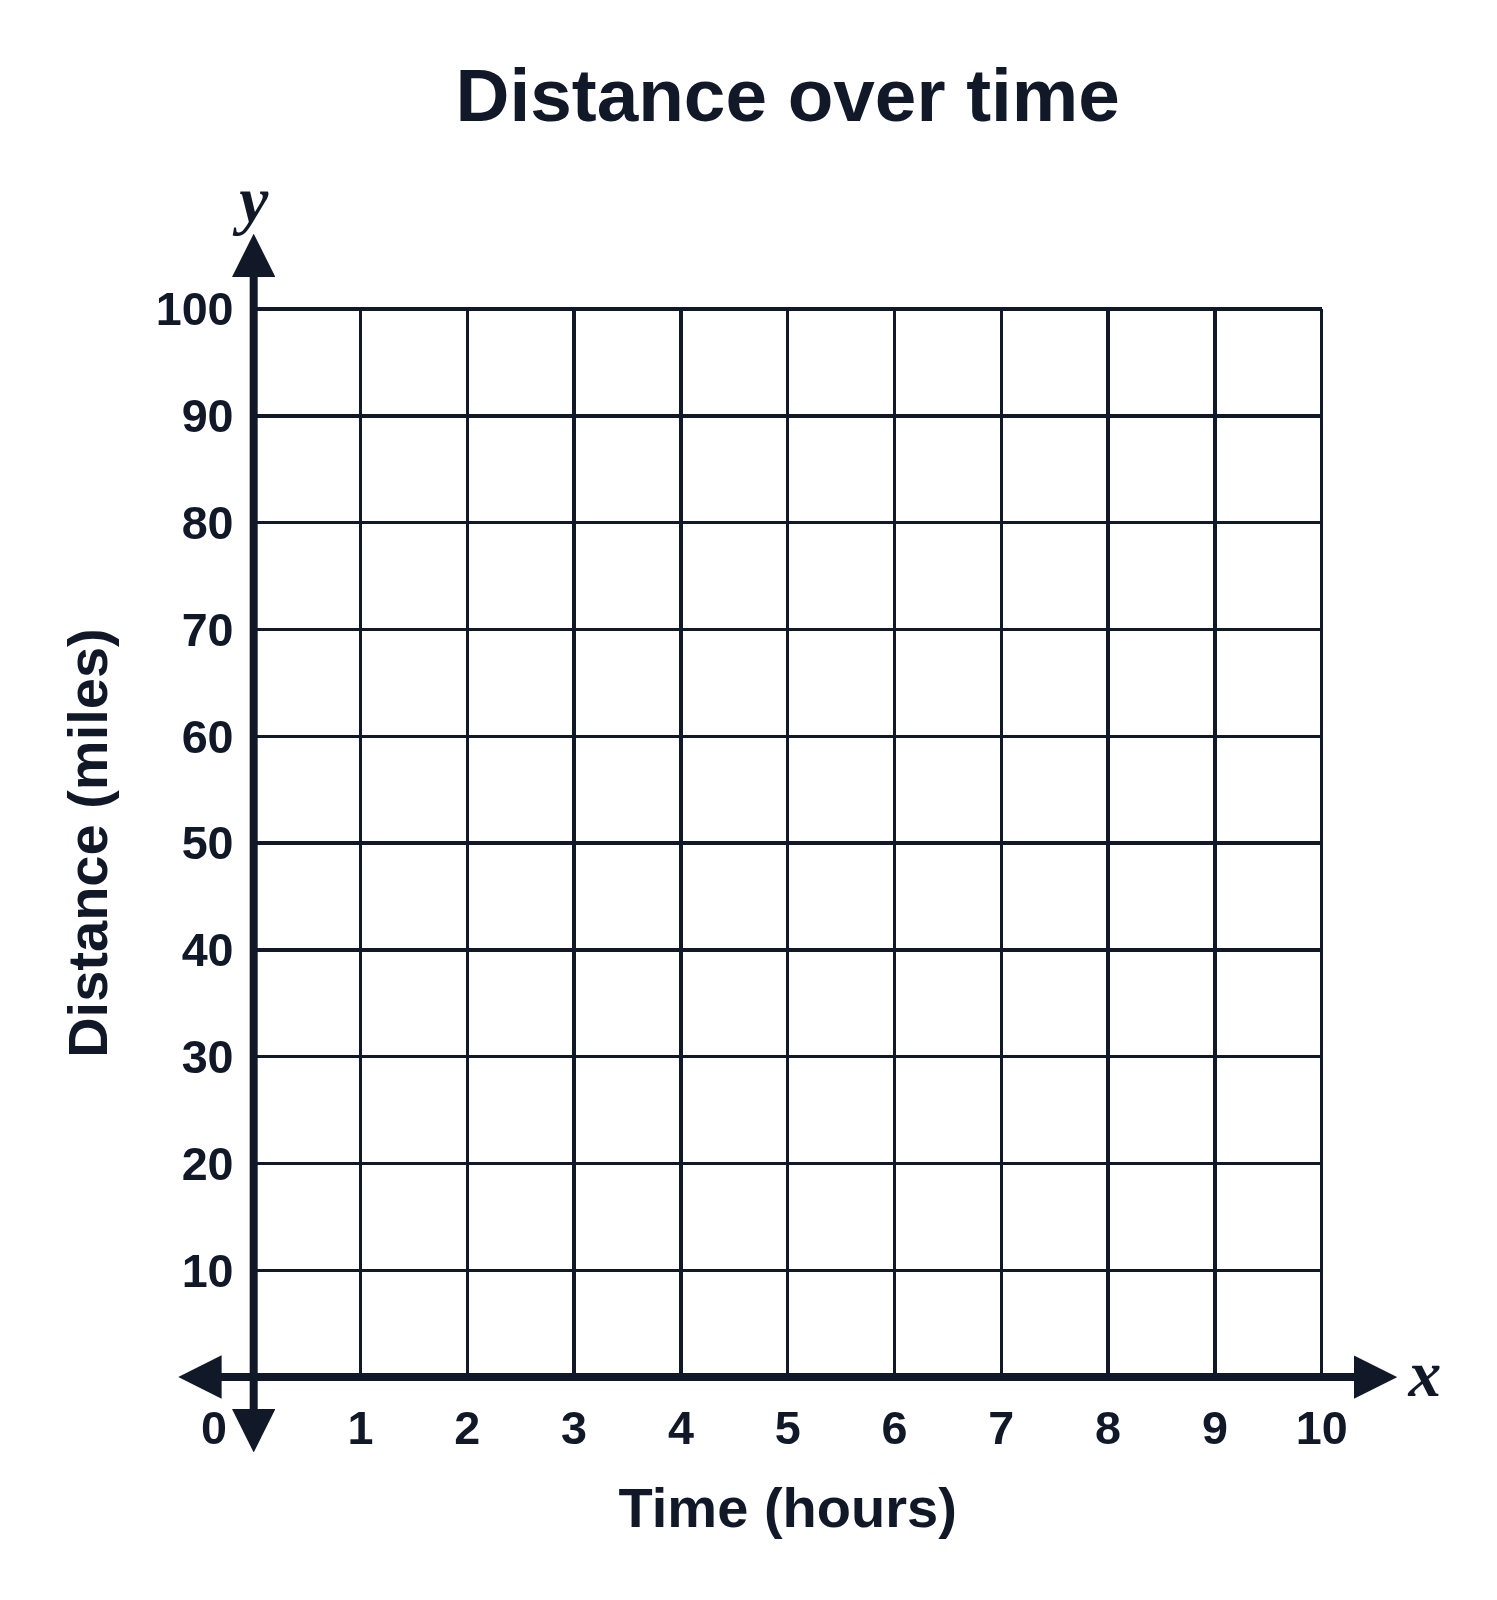
A blank first-quadrant grid titled Distance over time, with Time (hours) along the x-axis from 0 to 10 and Distance (miles) up the y-axis from 0 to 100 by 10
A blank first-quadrant grid with the chart title Distance over time. The x-axis is titled Time (hours) and numbered from 0 to 10 by 1; the y-axis is titled Distance (miles) and numbered from 0 to 100 by 10. Nothing is graphed, so students can plot a table of values or draw a line of best fit.

Editing opens it in the Coordinate Grid Generator with these settings, to change anything and copy or download your own.

Free to use in your tests, worksheets, slides or anything else. Open source under Apache 2.0. How to reuse our figures
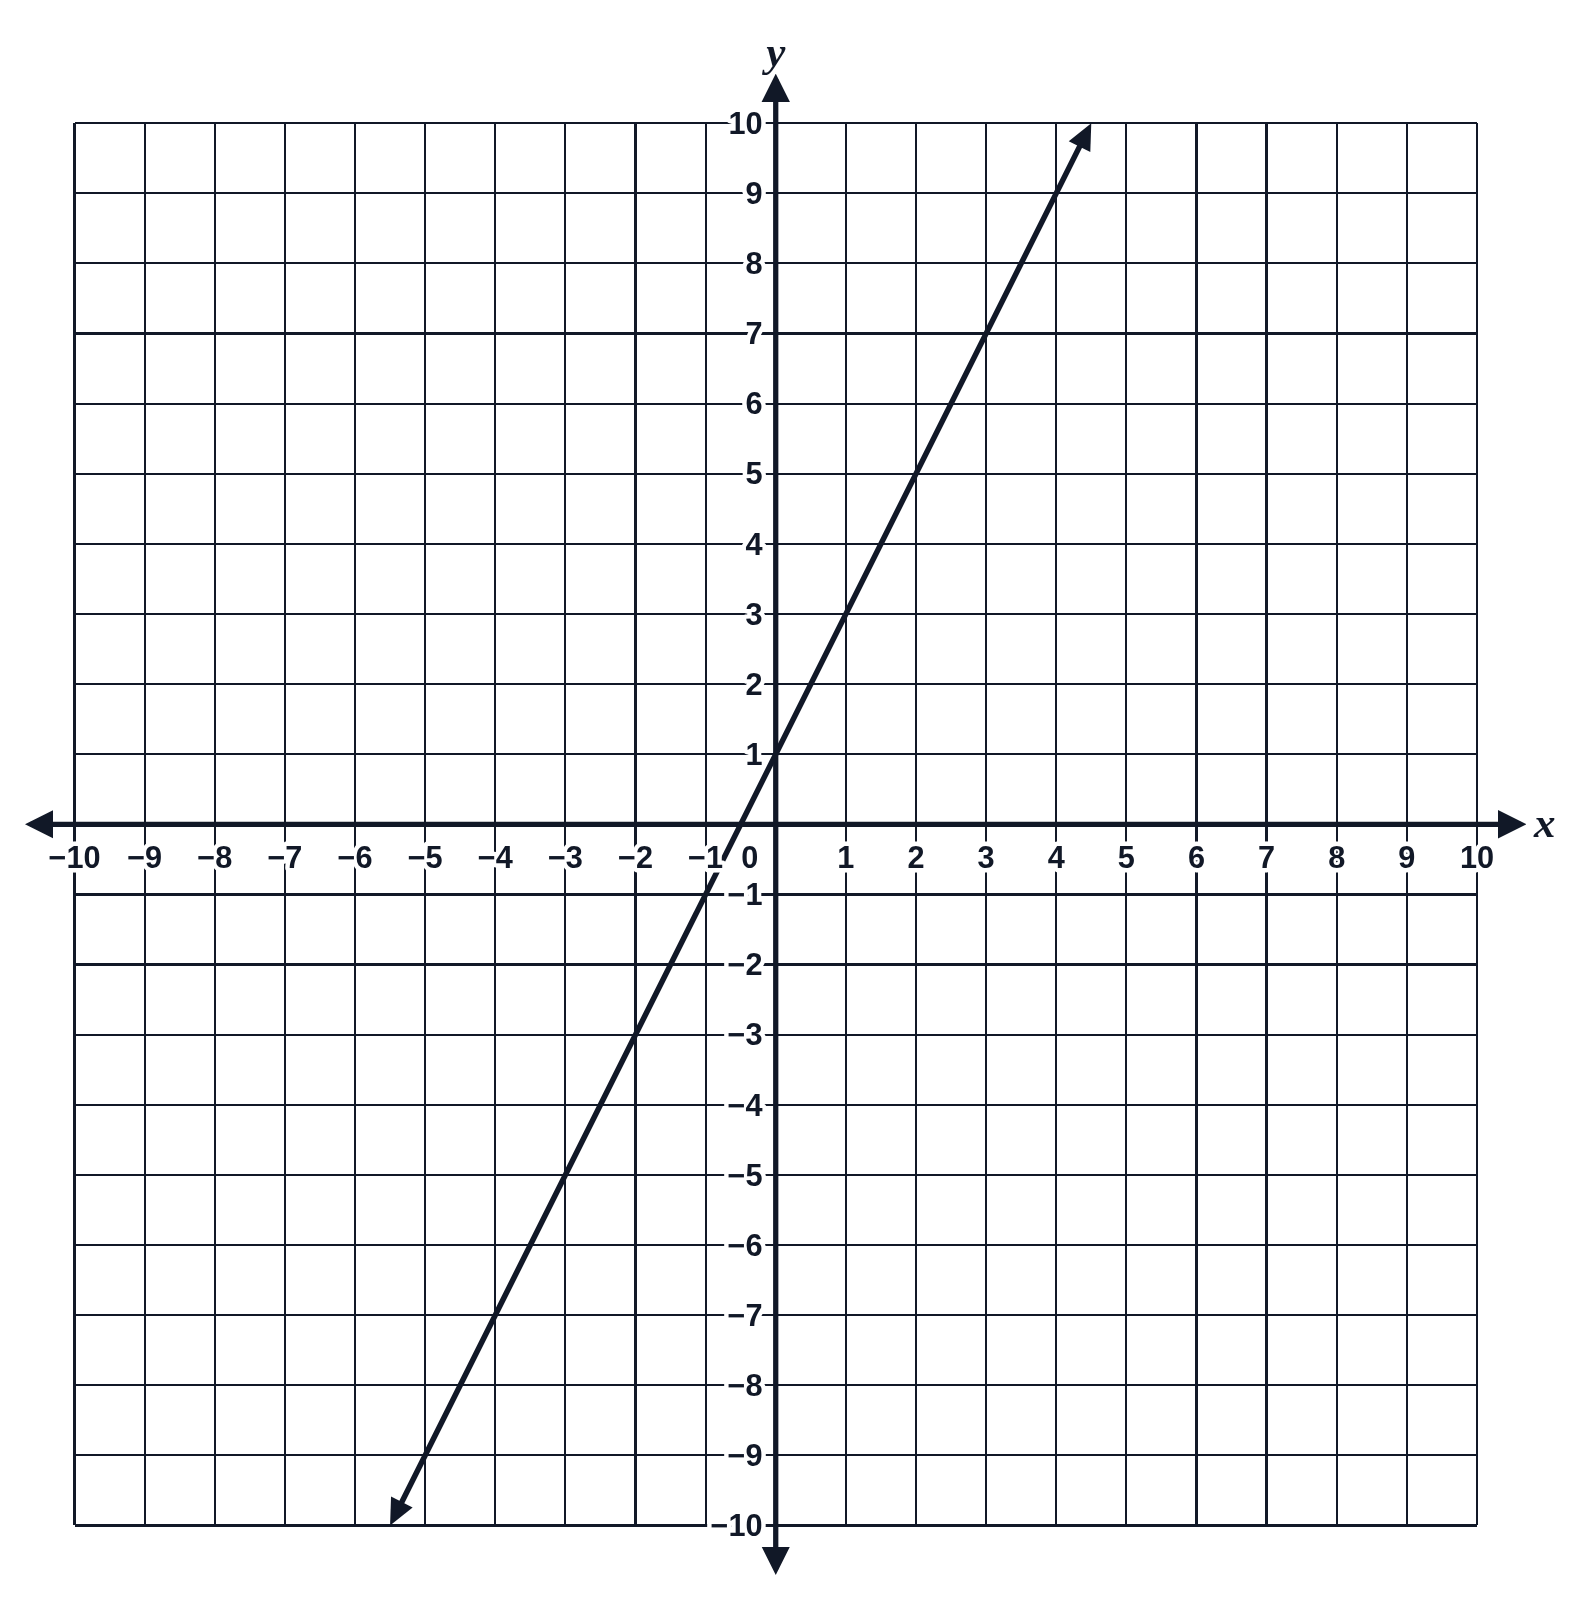
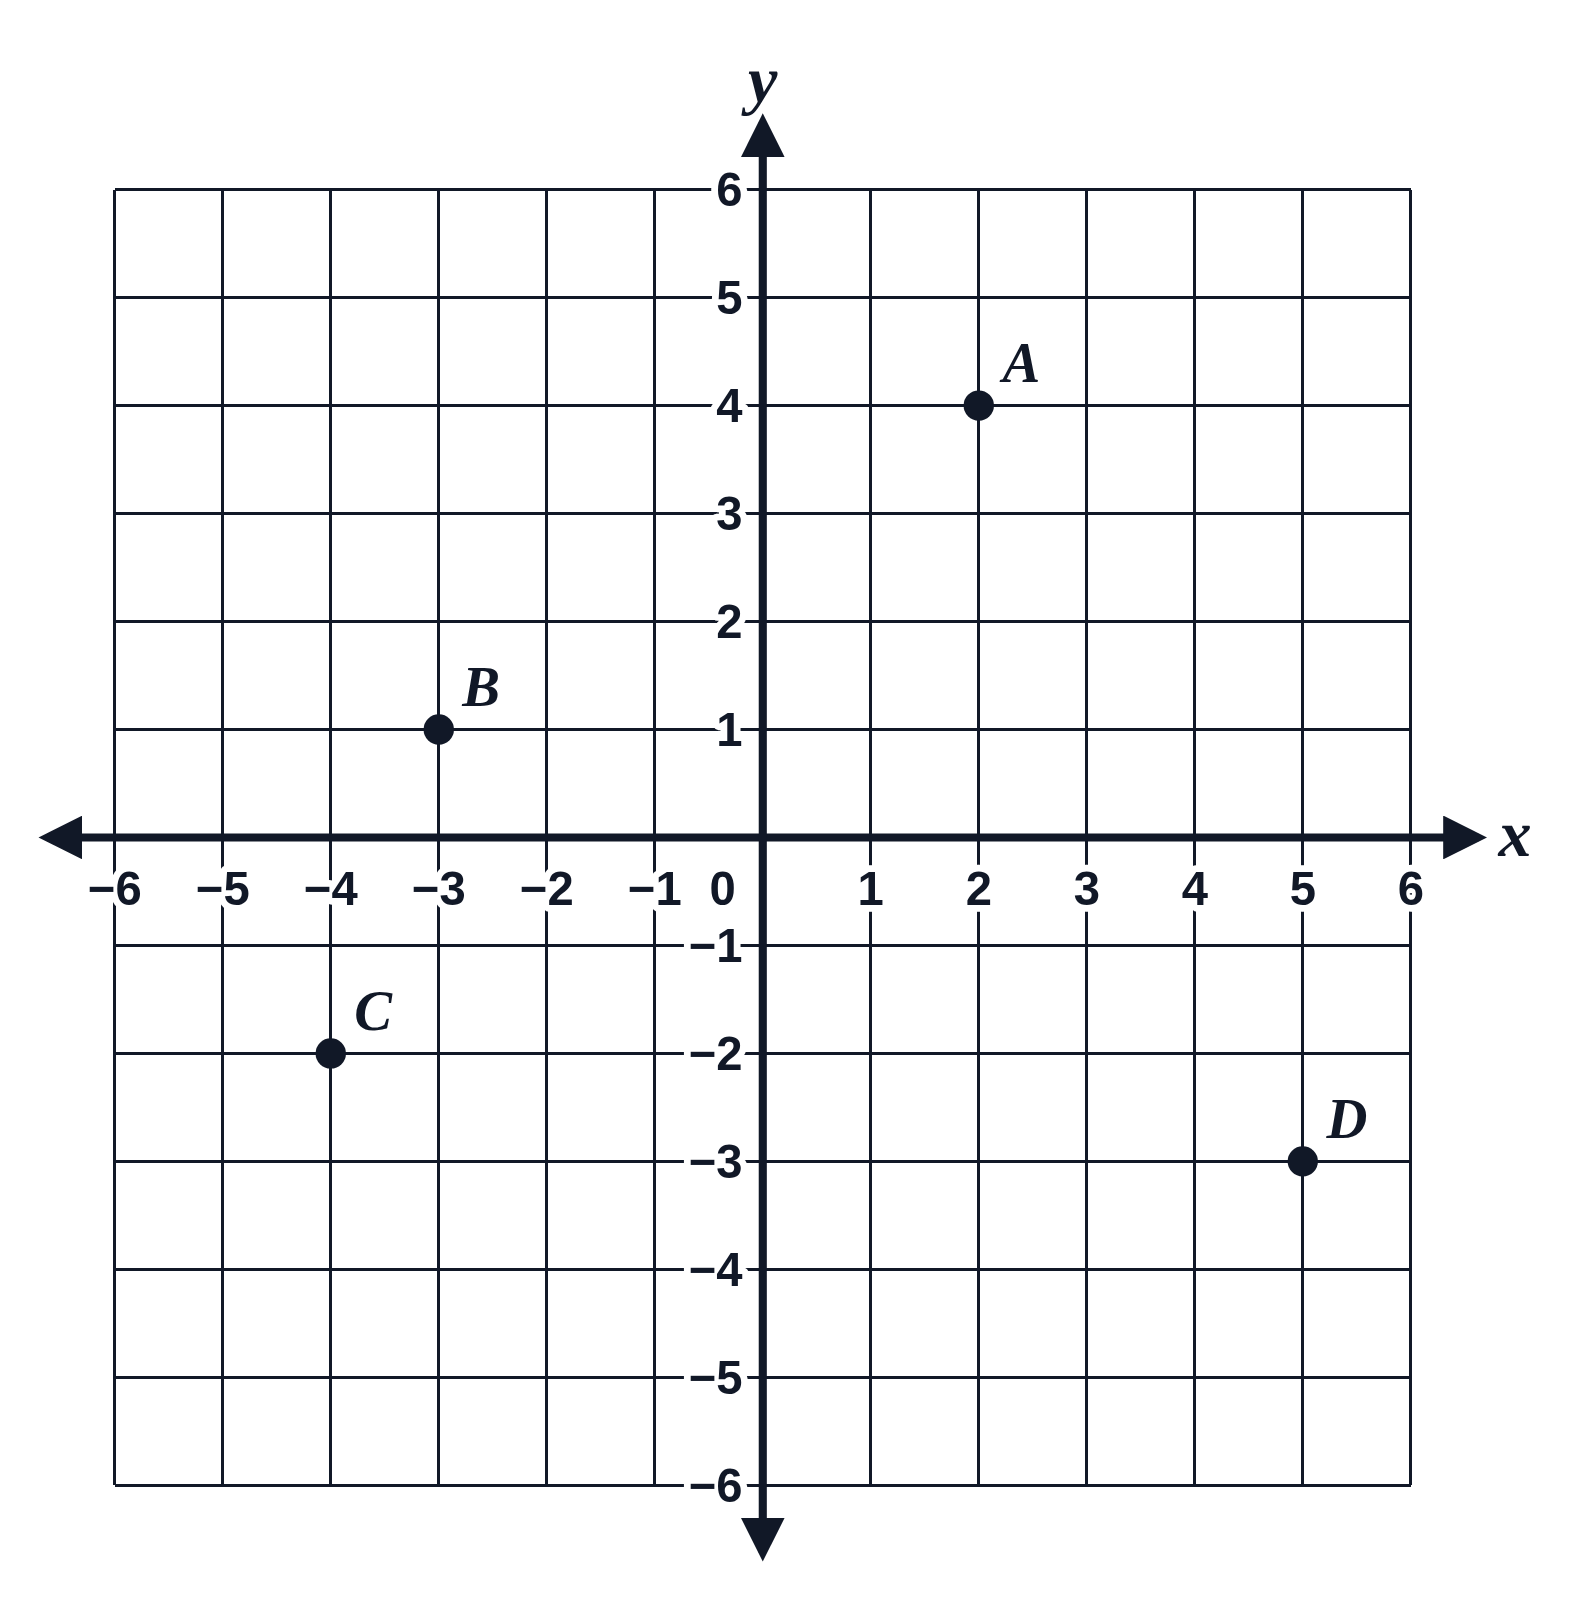
More Coordinate Grid examples