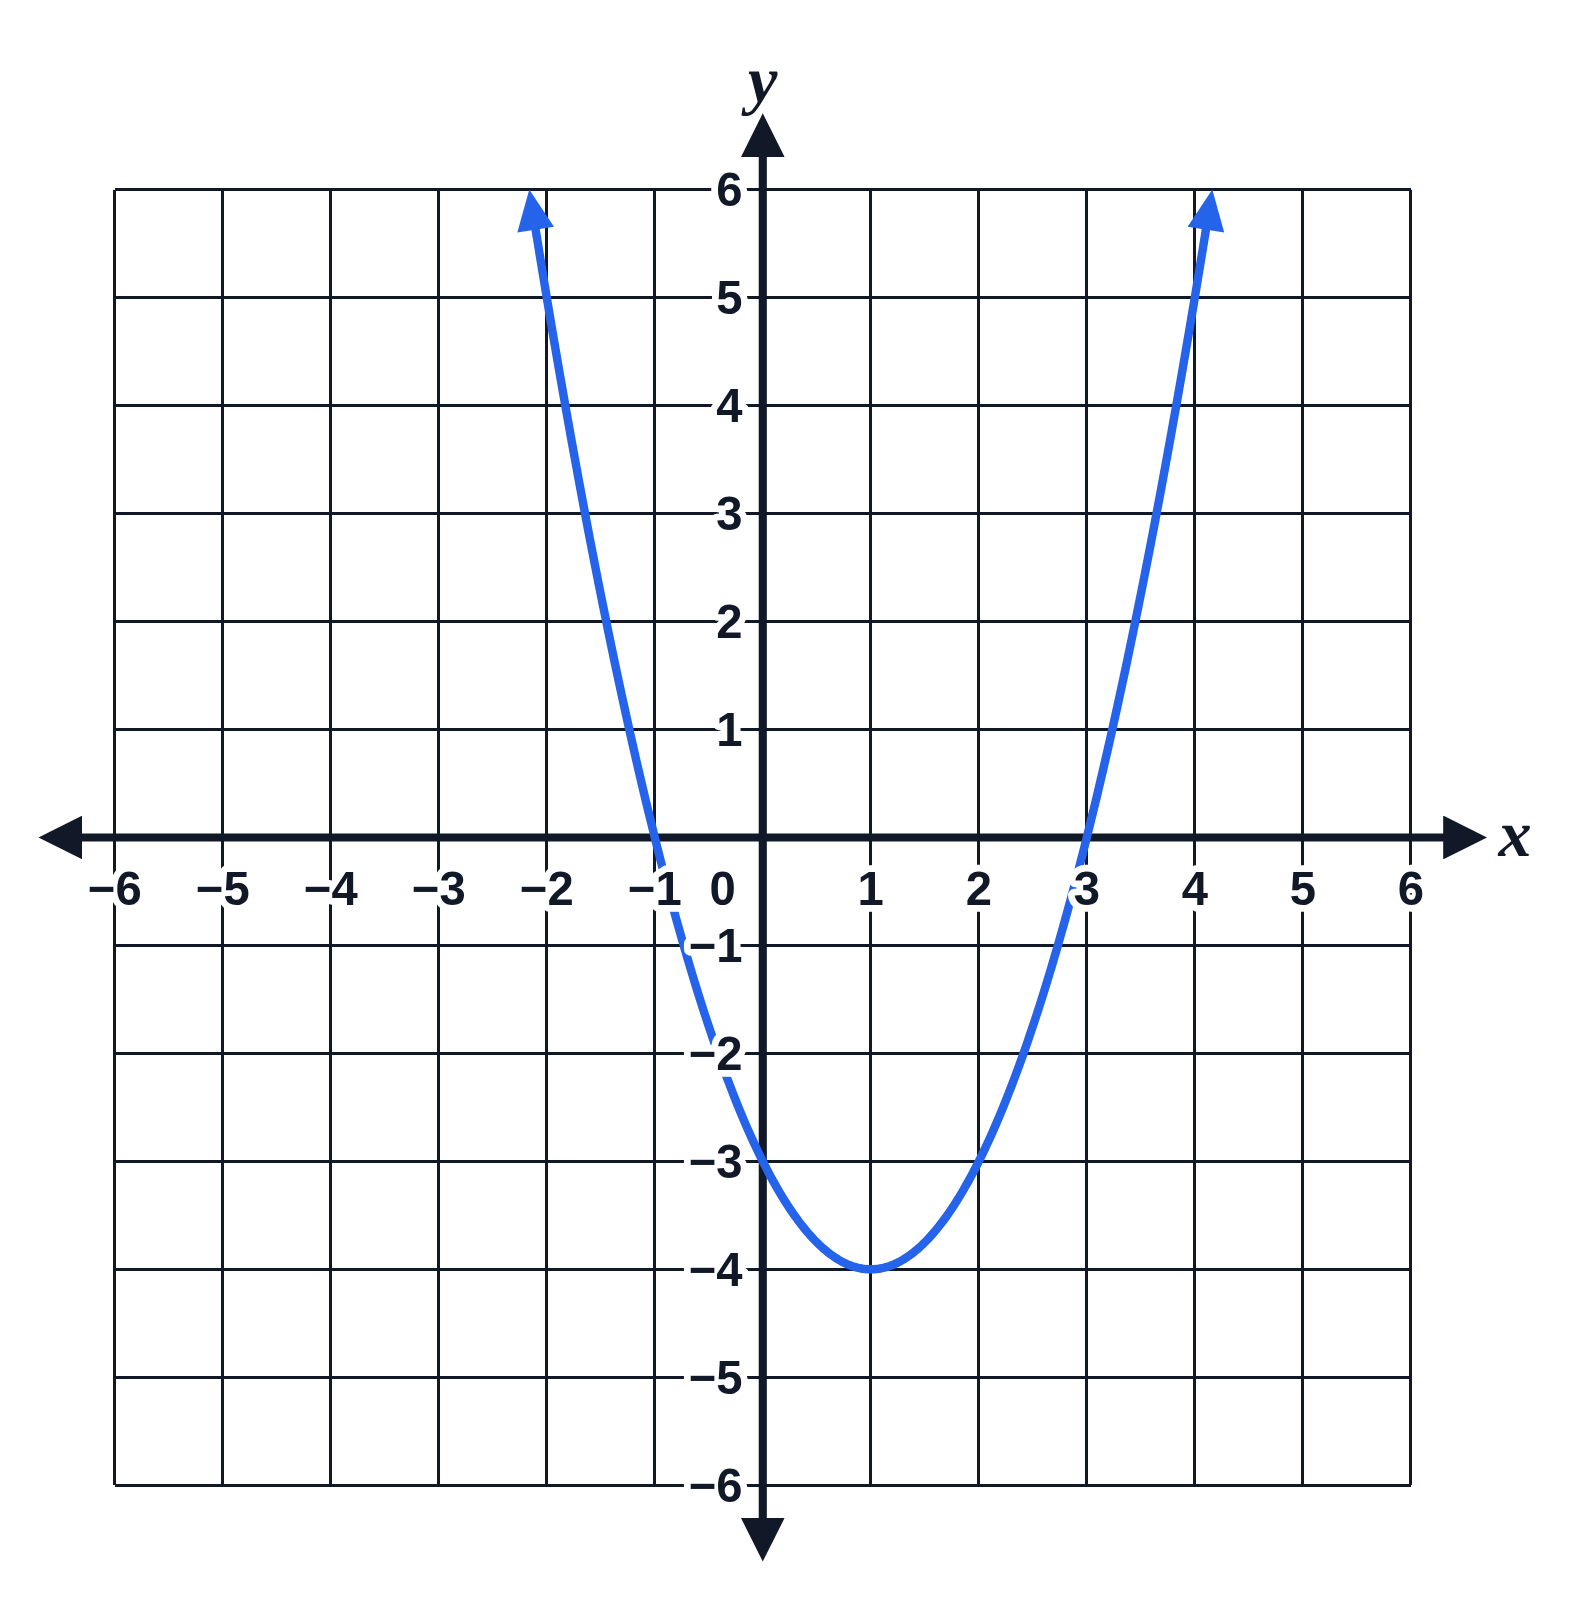
Graph of the parabola y = x² − 2x − 3
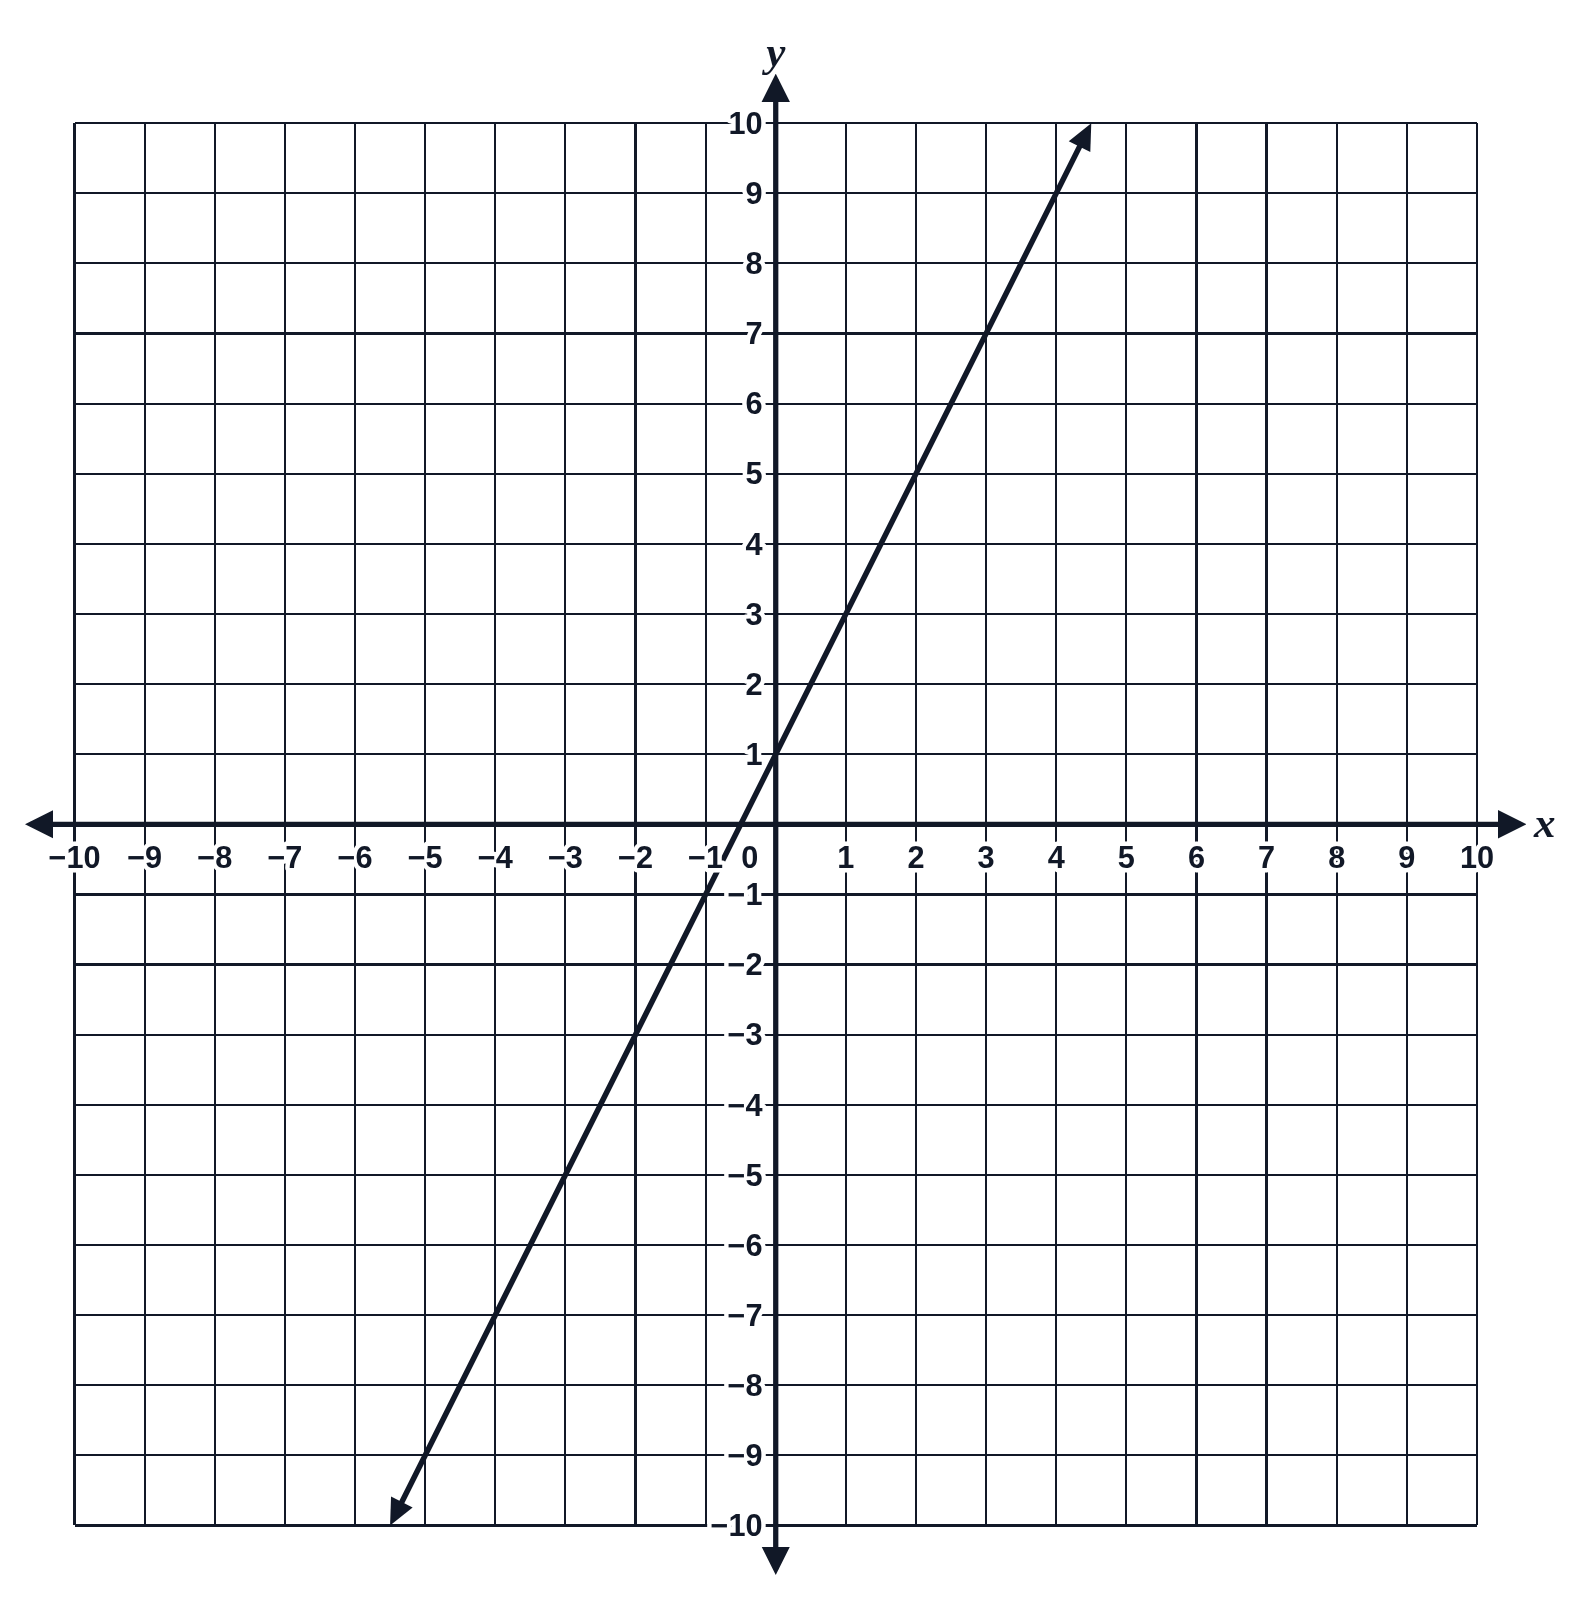
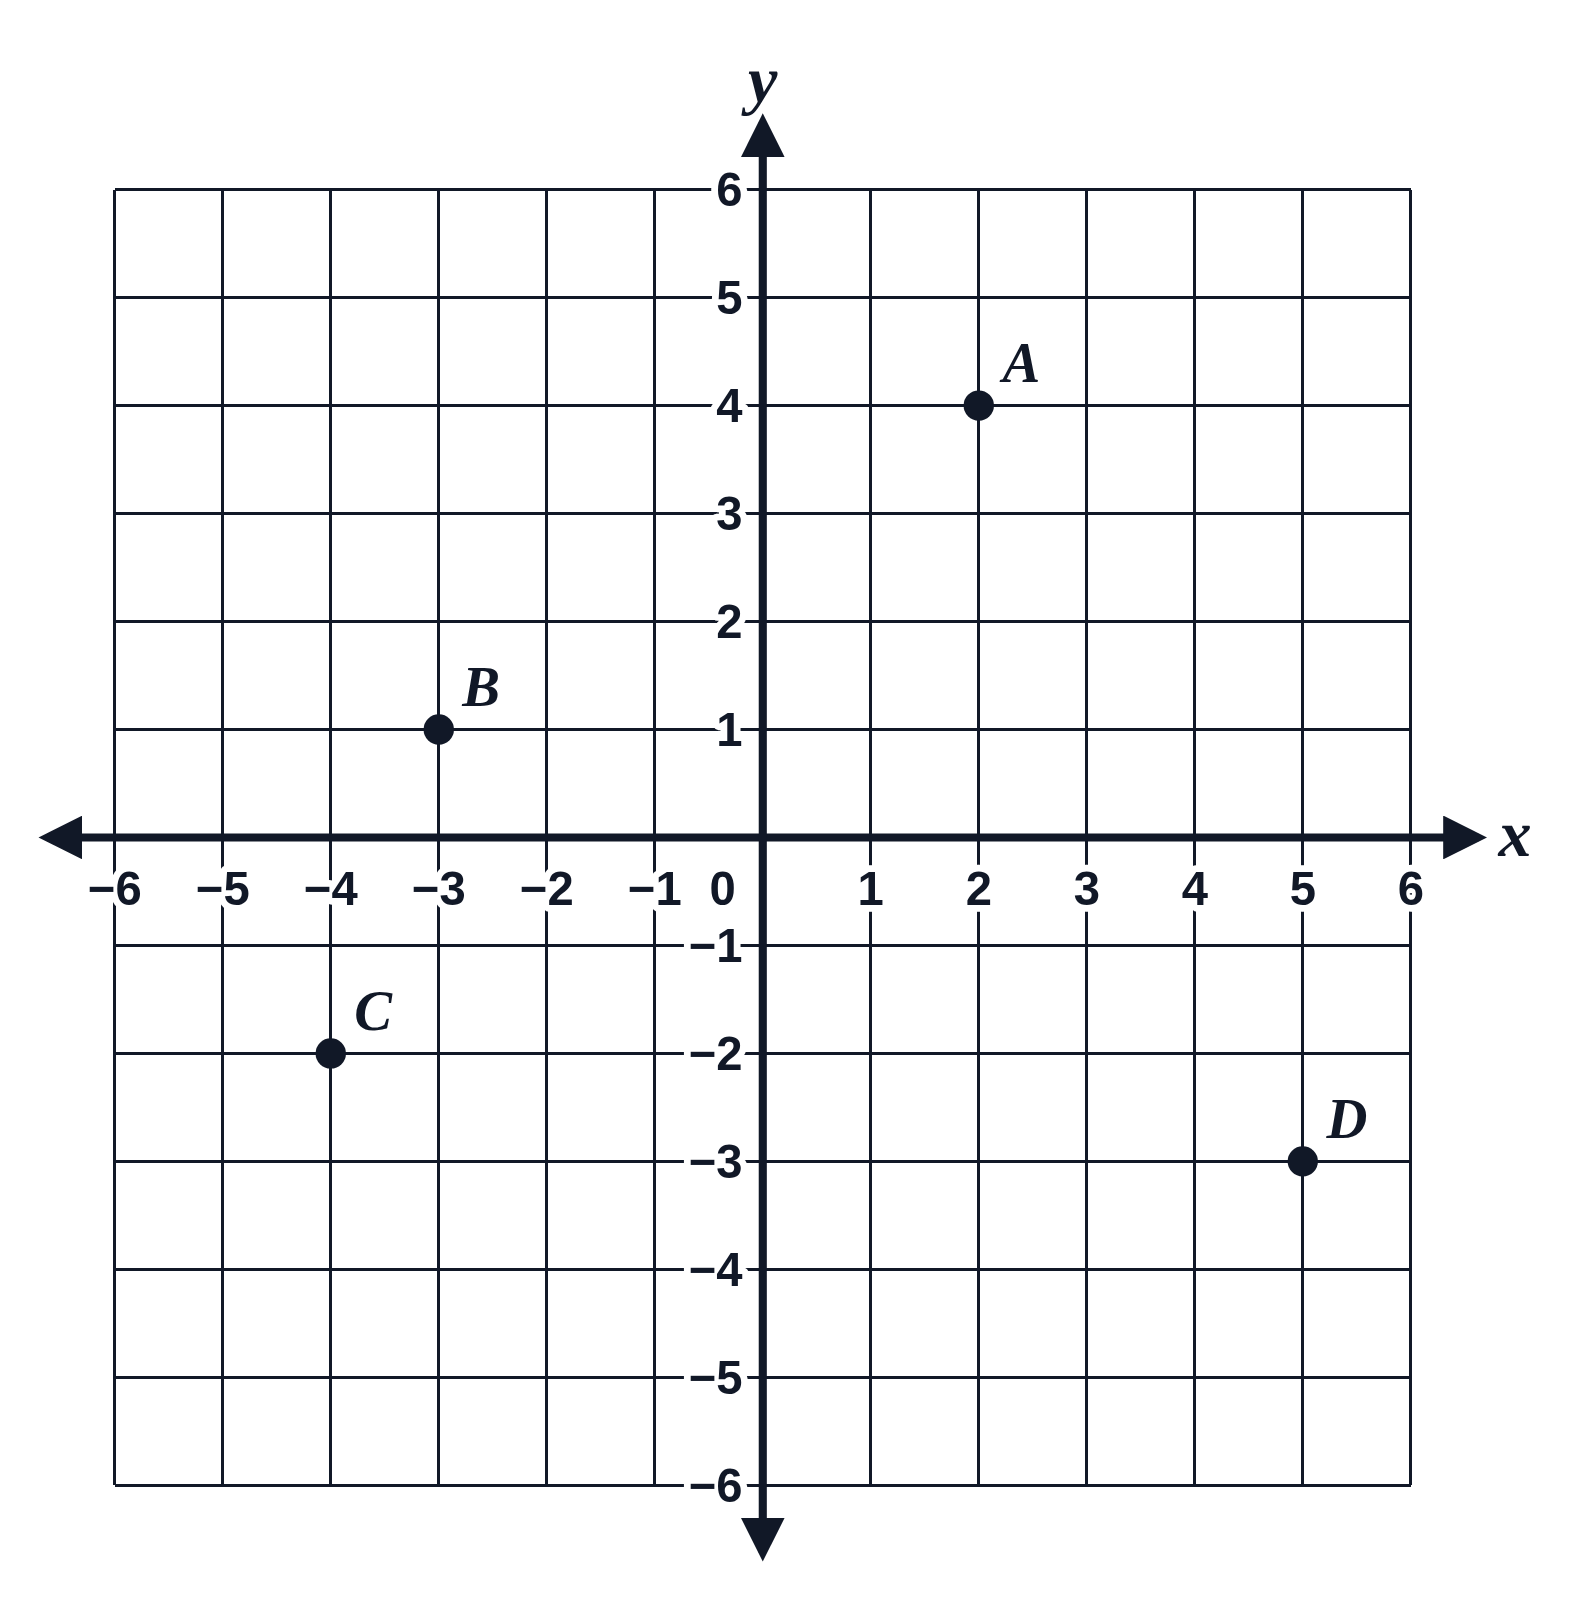
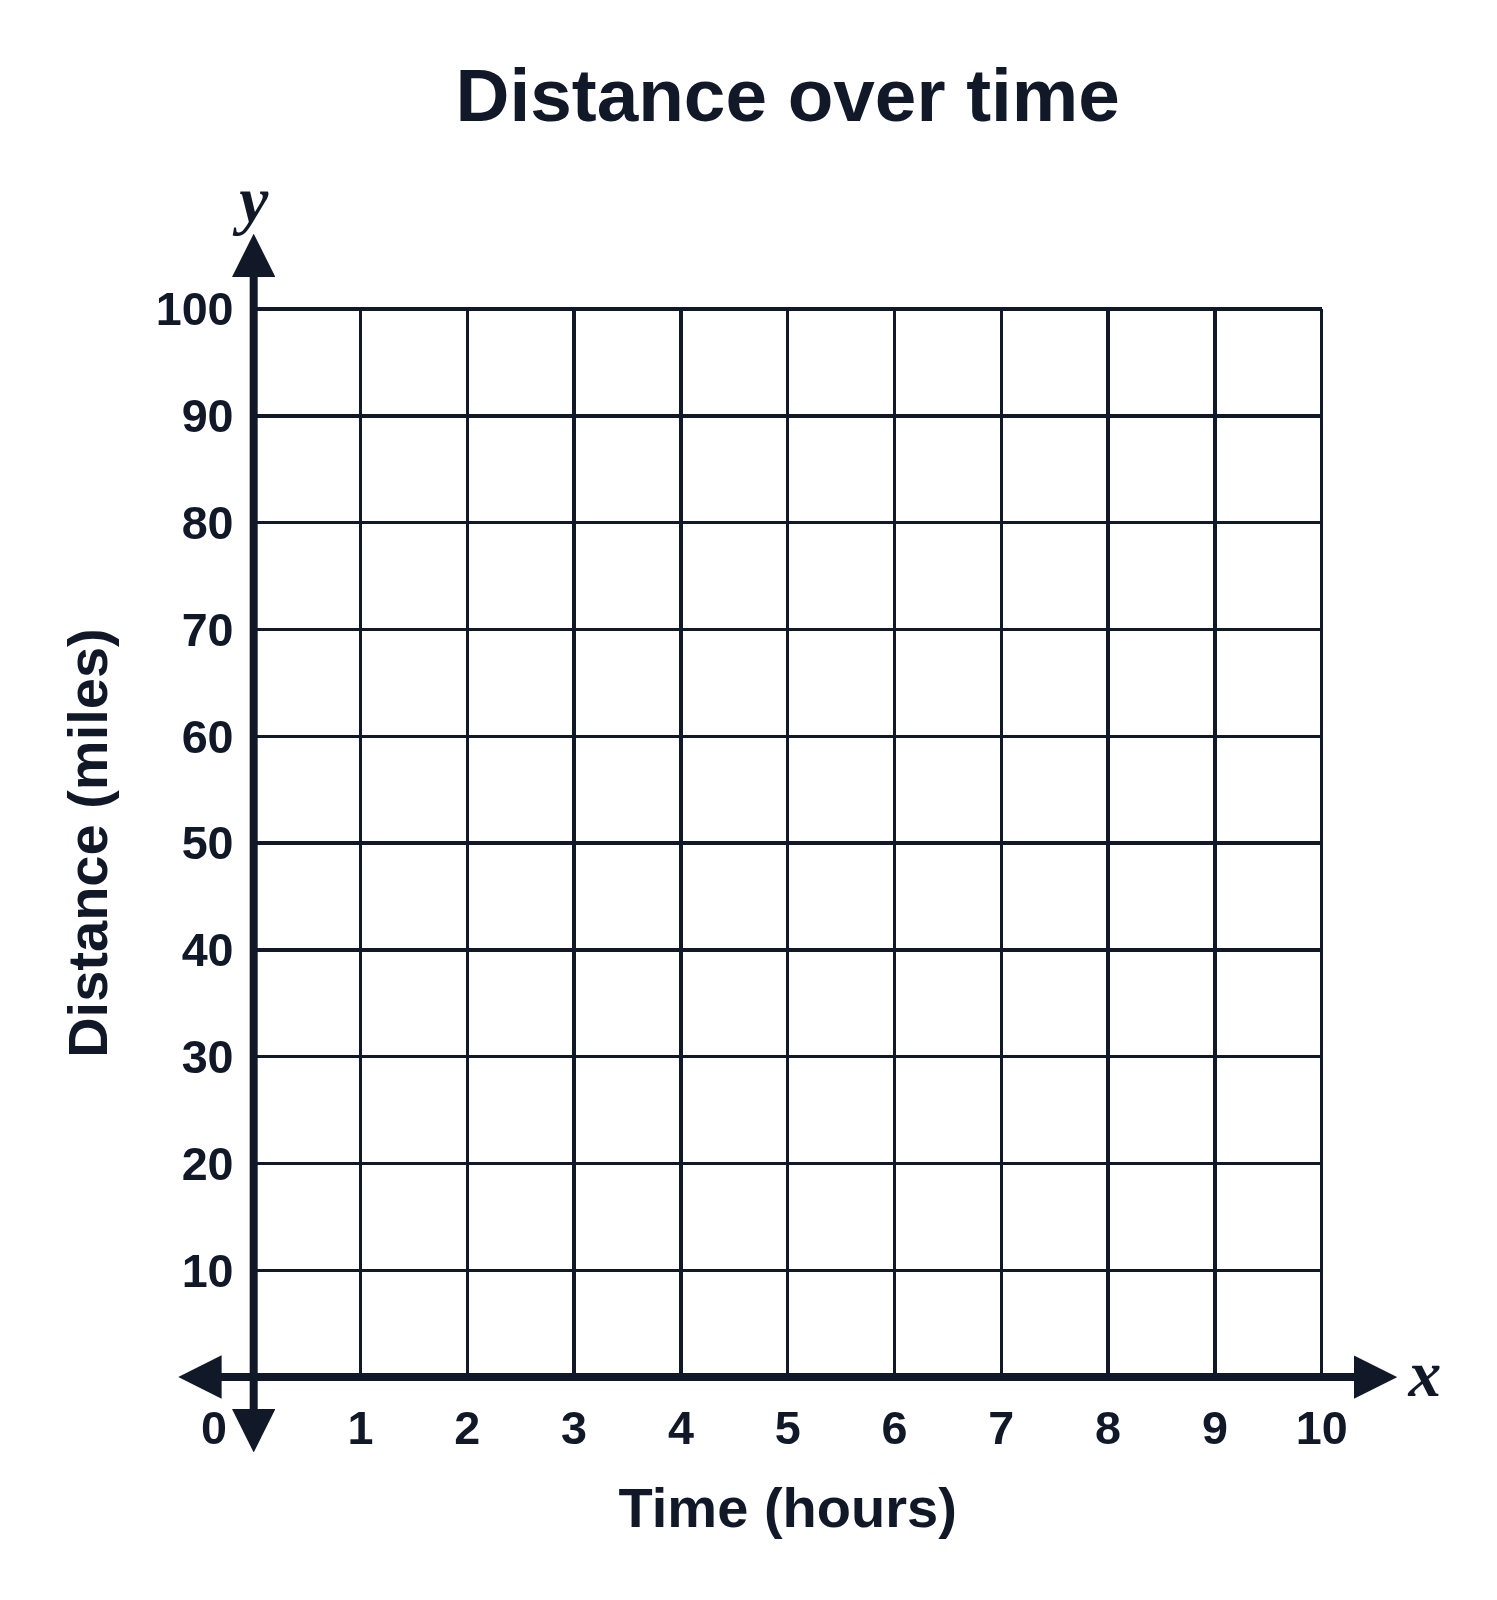
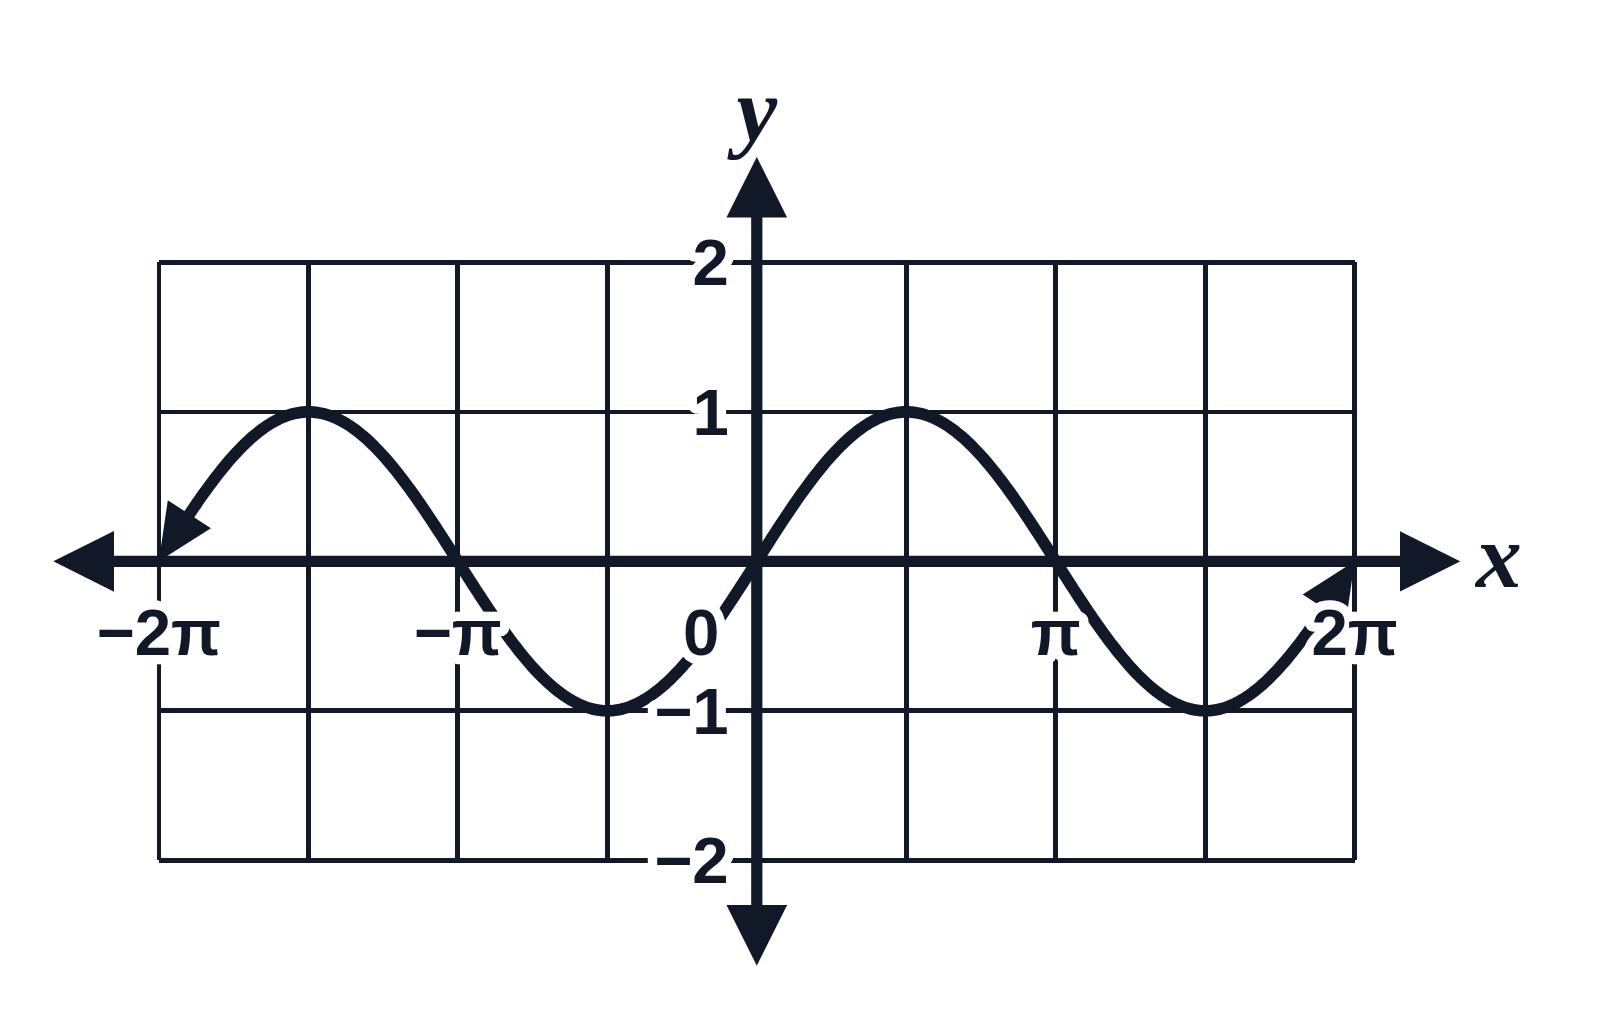
An example figure from the Coordinate Grid Generator.
Editing opens it in the Coordinate Grid Generator with these settings, to change anything and copy or download your own.
Answer key
- y = x² − 2x − 3
Free to use in your tests, worksheets, slides or anything else. Open source under Apache 2.0. How to reuse our figures