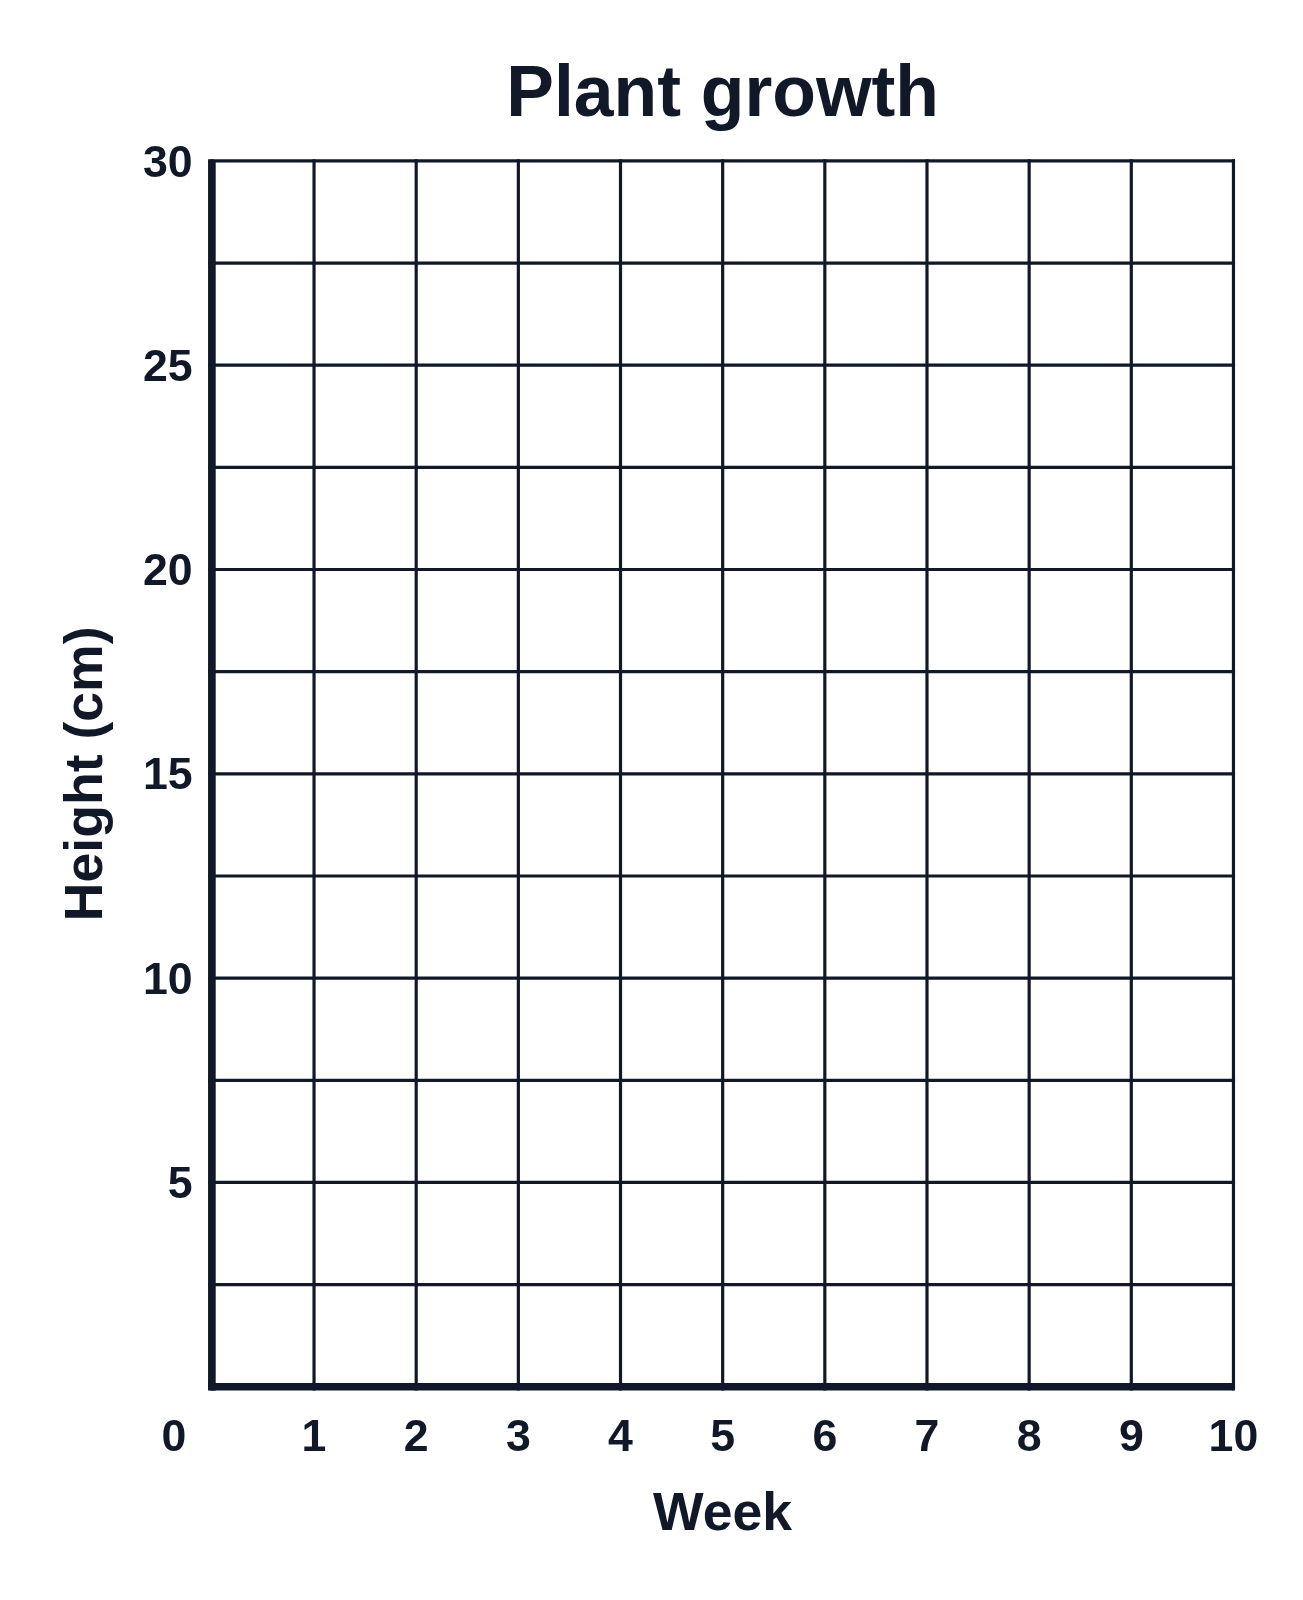
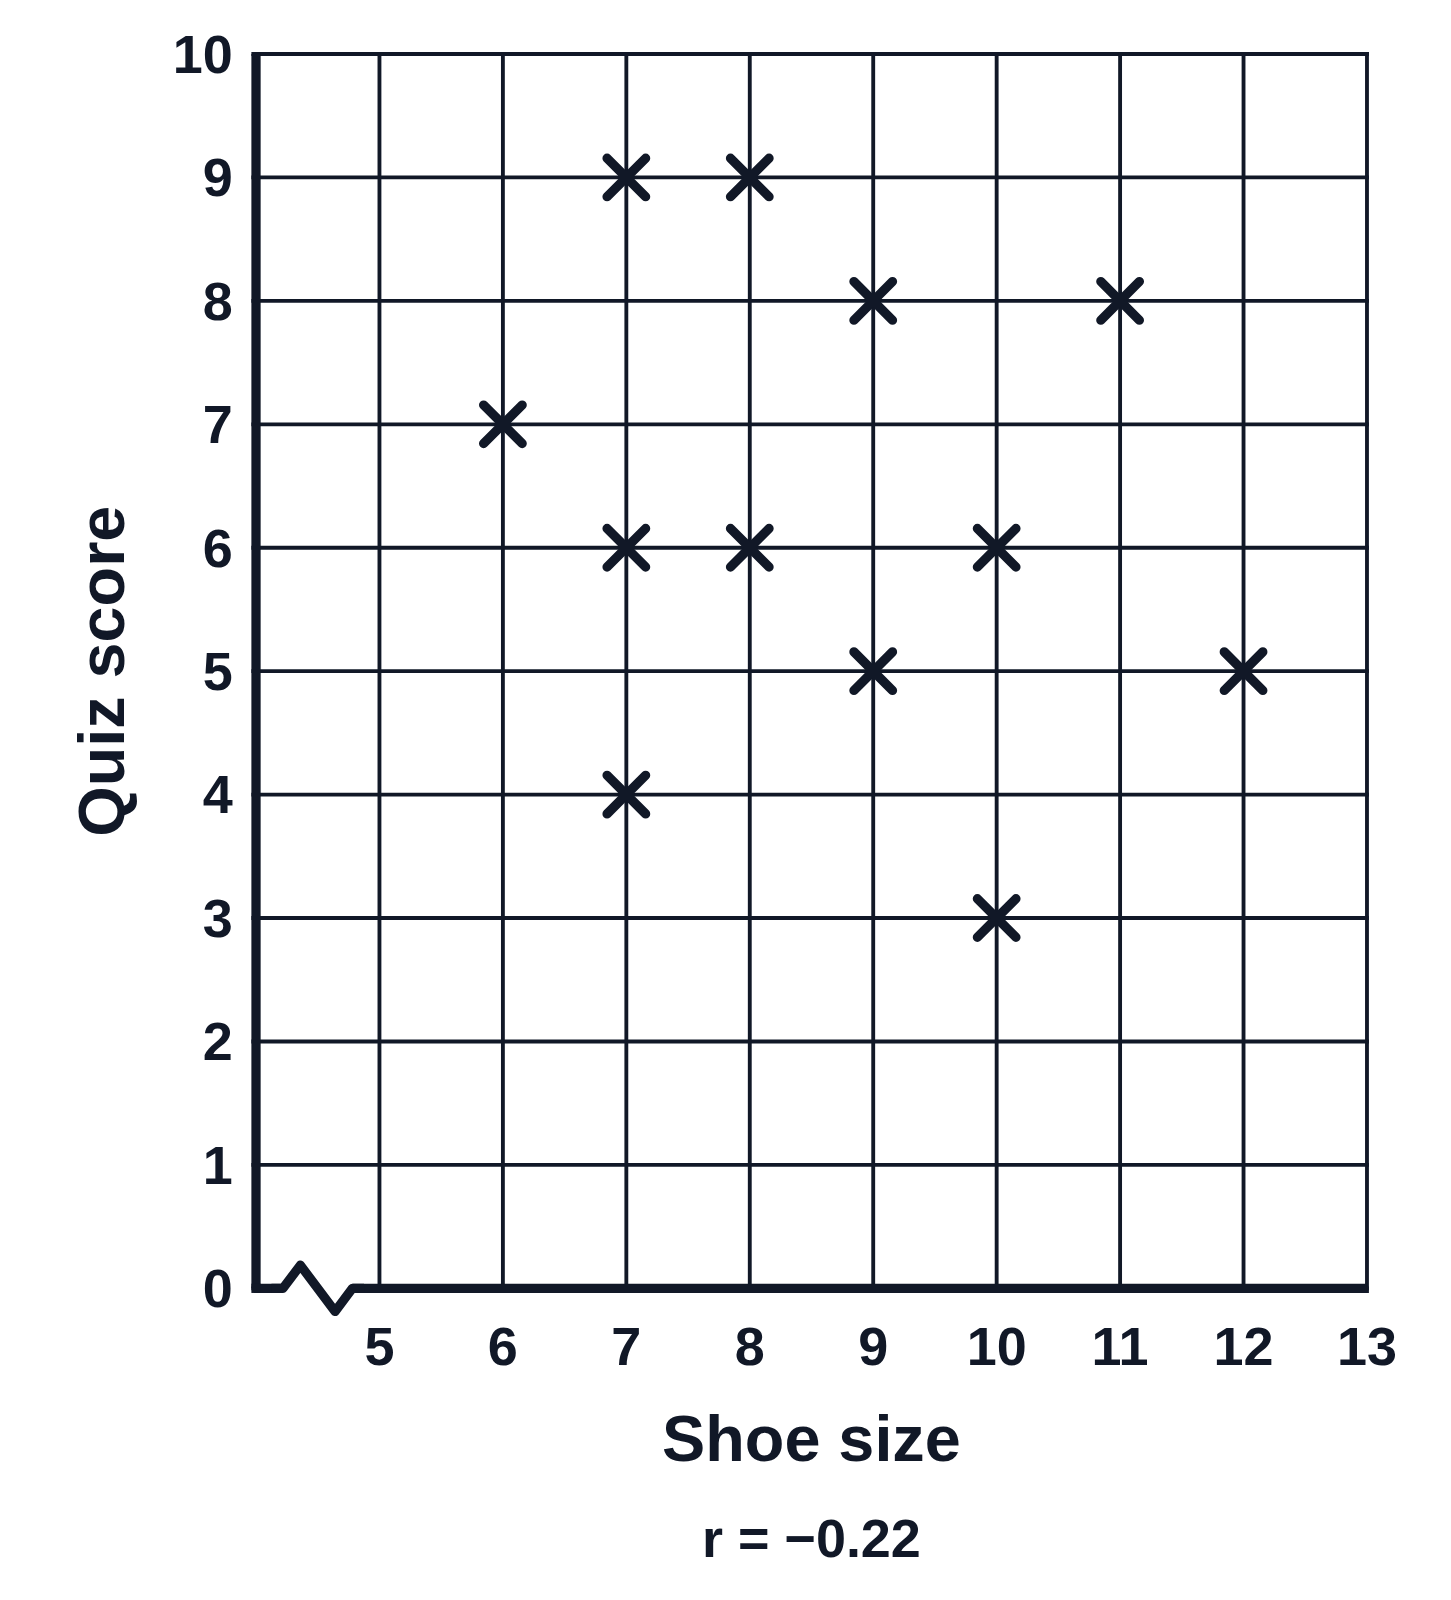
Scatter plot with no correlation: shoe size and quiz score
An example figure from the Scatter Plot Generator.
Editing opens it in the Scatter Plot Generator with these settings, to change anything and copy or download your own.
Answer key
- Number of points: 12
- Line of best fit (least squares): y = −0.24x + 8.38
- r = −0.22 (little or no correlation), r² = 0.05
Free to use in your tests, worksheets, slides or anything else, no credit needed. Public domain under CC0 1.0. How to reuse our figures