Scatter plot of hours studied and test scores, with a line of best fit

An example figure from the Scatter Plot Generator.
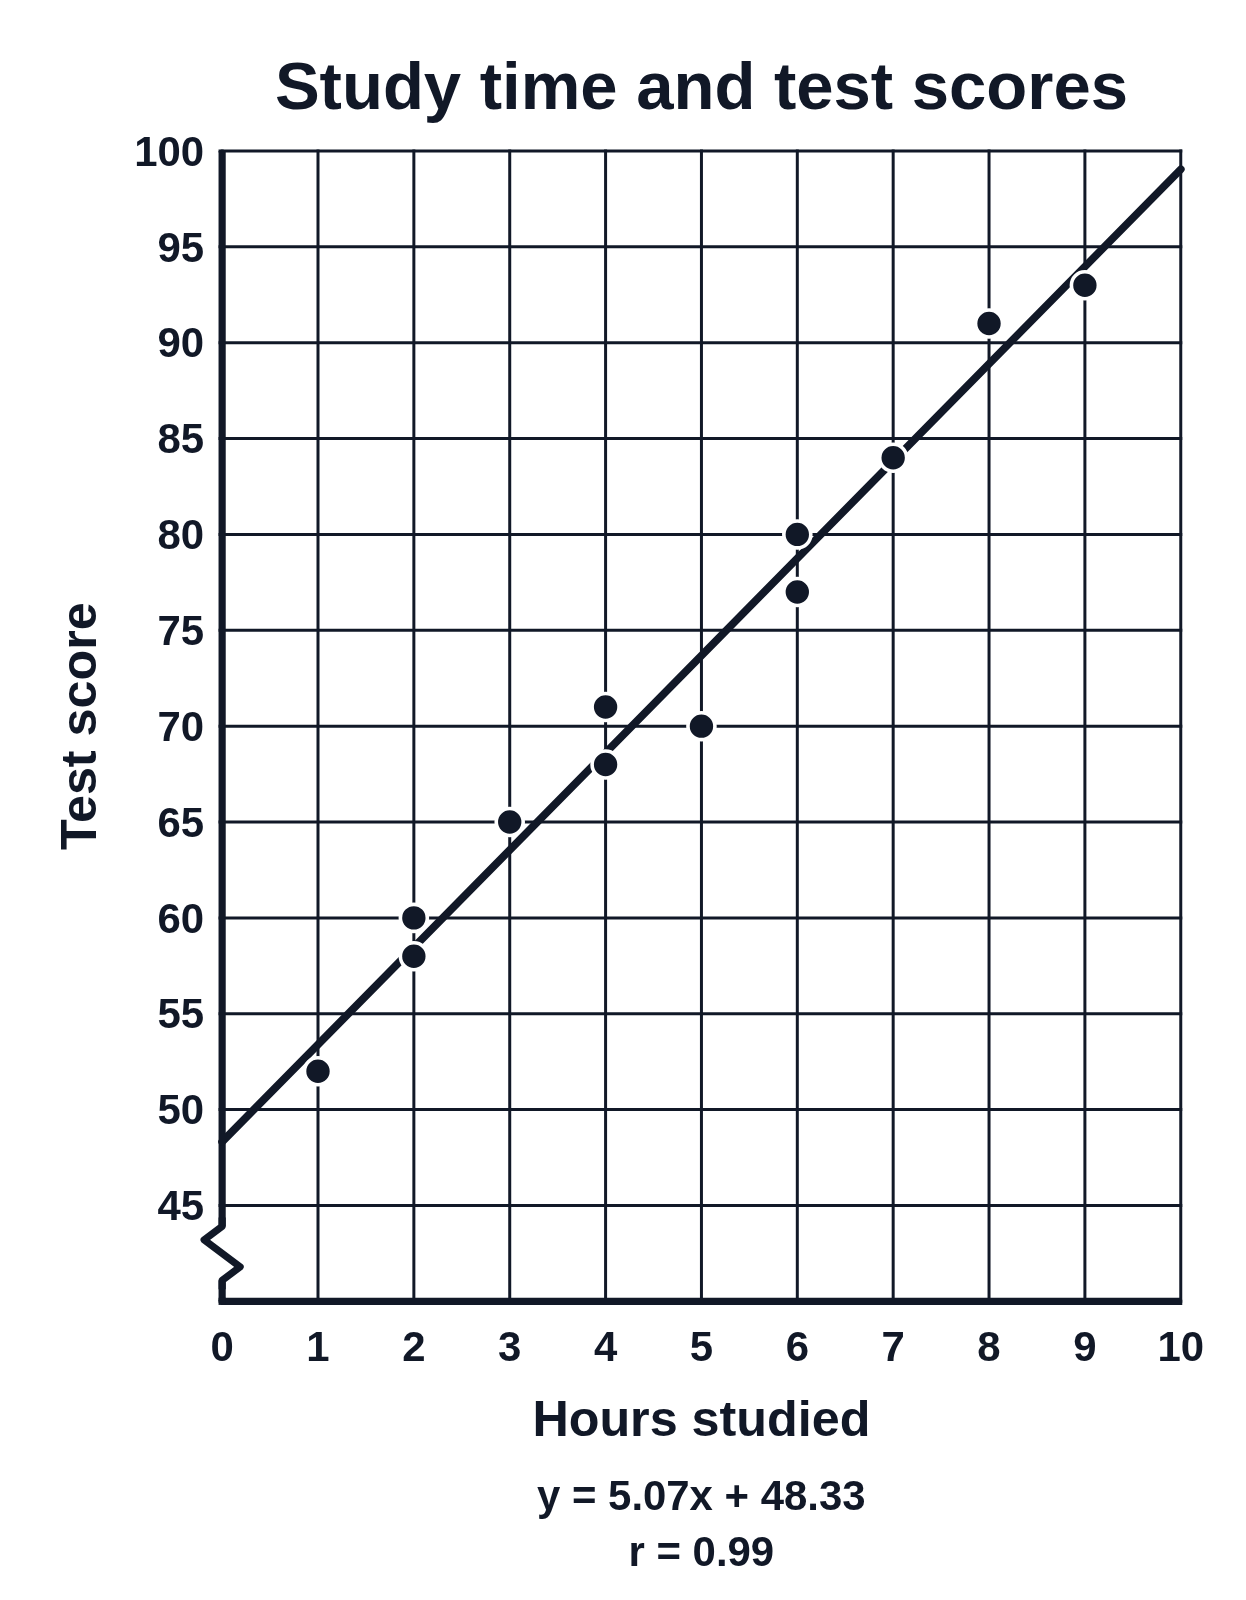
A scatter plot of 12 students’ hours studied against their test scores, with the least-squares line y = 5.07x + 48.33 drawn, the equation and r = 0.99 written below the graph, and a zig-zag break at the bottom of the score axis
A scatter plot of hours studied (0 to 10) against test score for 12 students, with the score axis running from 45 to 100 after a zig-zag break. The least-squares line of best fit, y = 5.07x + 48.33, runs through the points, and r = 0.99 shows a strong positive correlation. Use it to interpret the slope and intercept or to predict a score.

Editing opens it in the Scatter Plot Generator with these settings, to change anything and copy or download your own.

Answer key

  • Number of points: 12
  • Line of best fit (least squares): y = 5.07x + 48.33
  • r = 0.99 (strong positive correlation), r² = 0.98

Free to use in your tests, worksheets, slides or anything else, no credit needed. Public domain under CC0 1.0. How to reuse our figures
More Scatter Plot examples