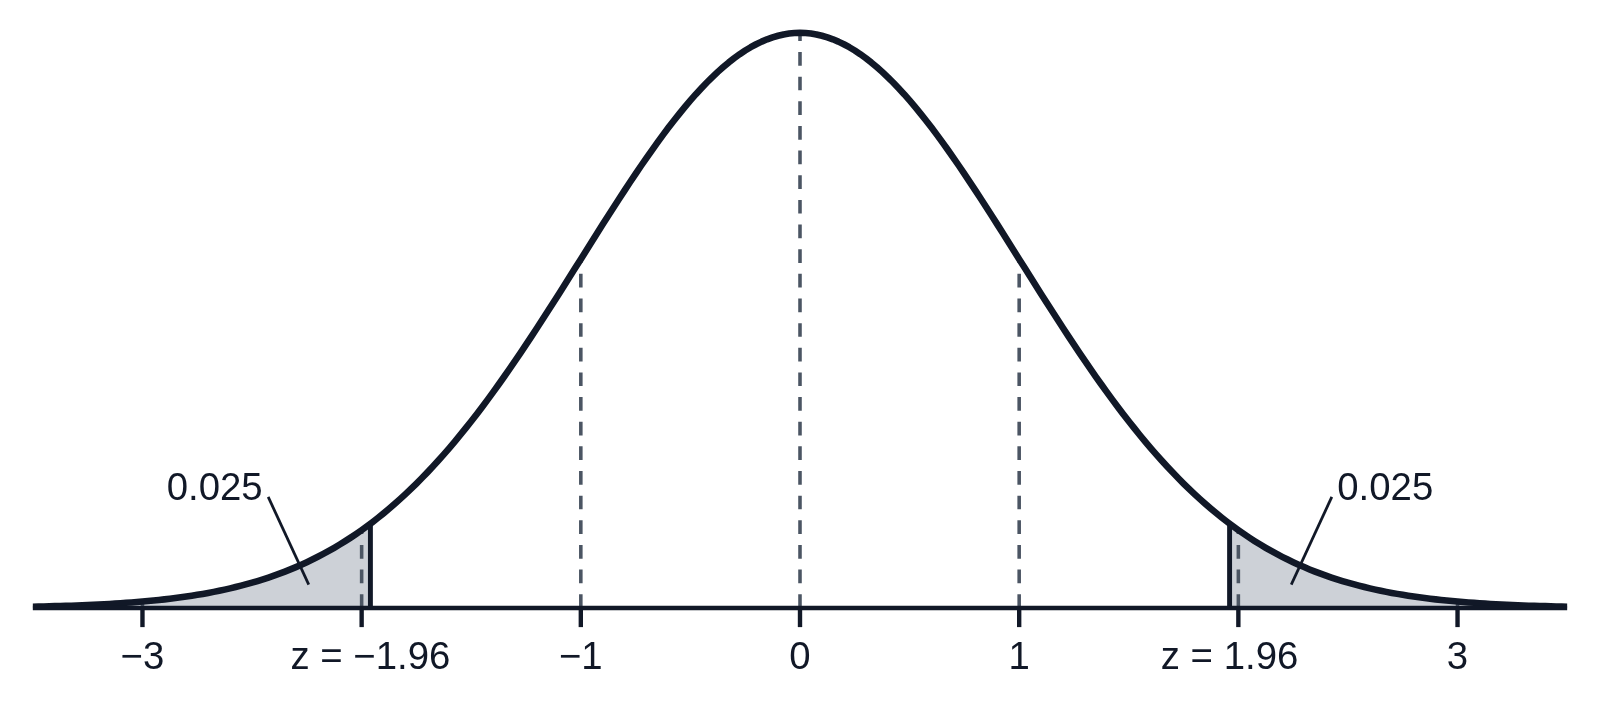
Two-tailed test: critical values z = ±1.96

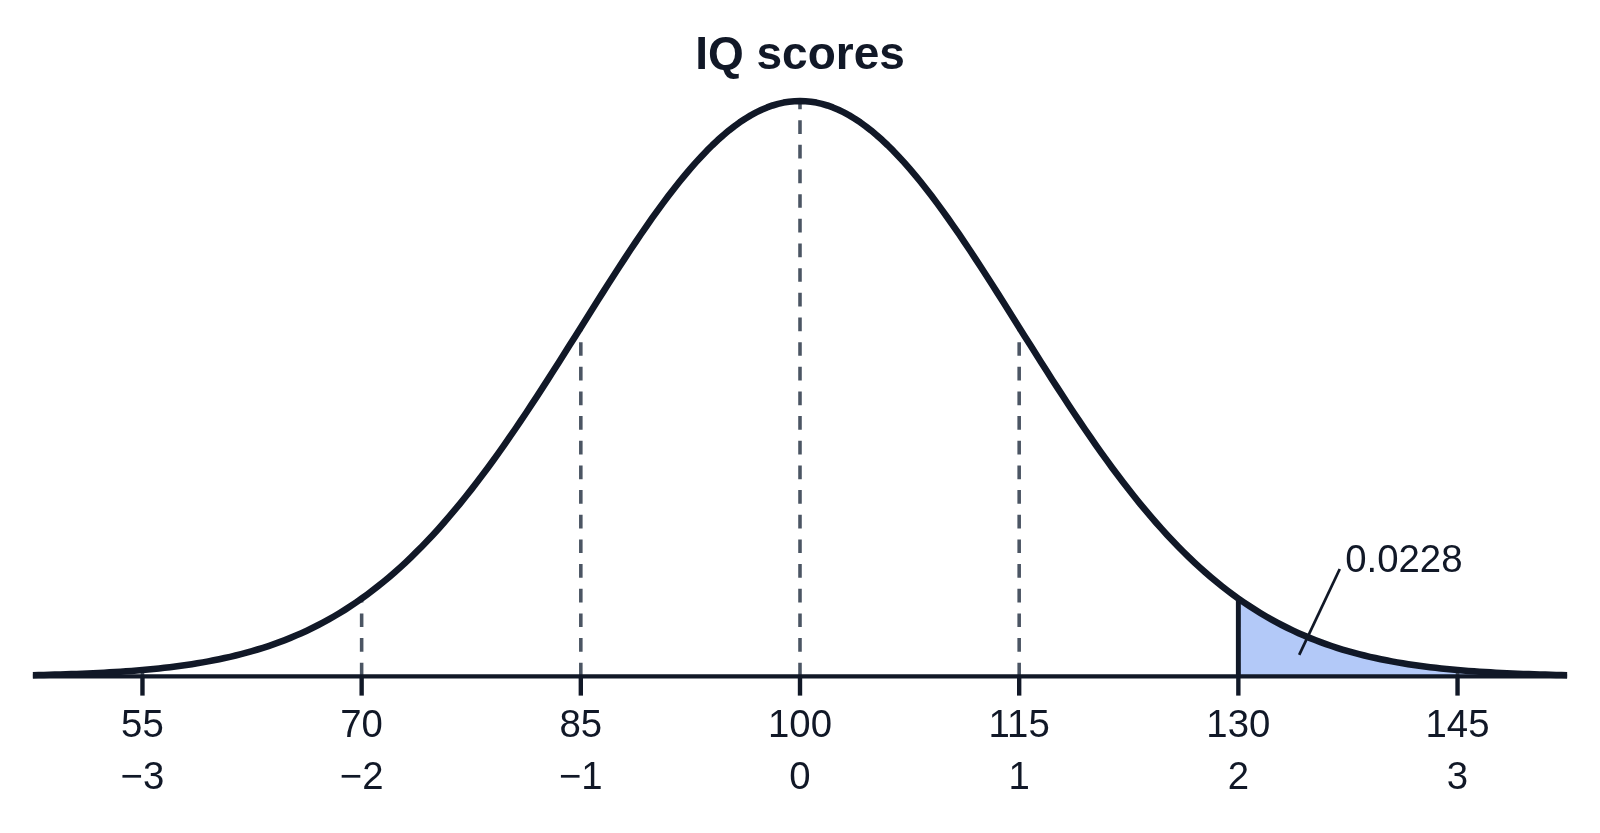
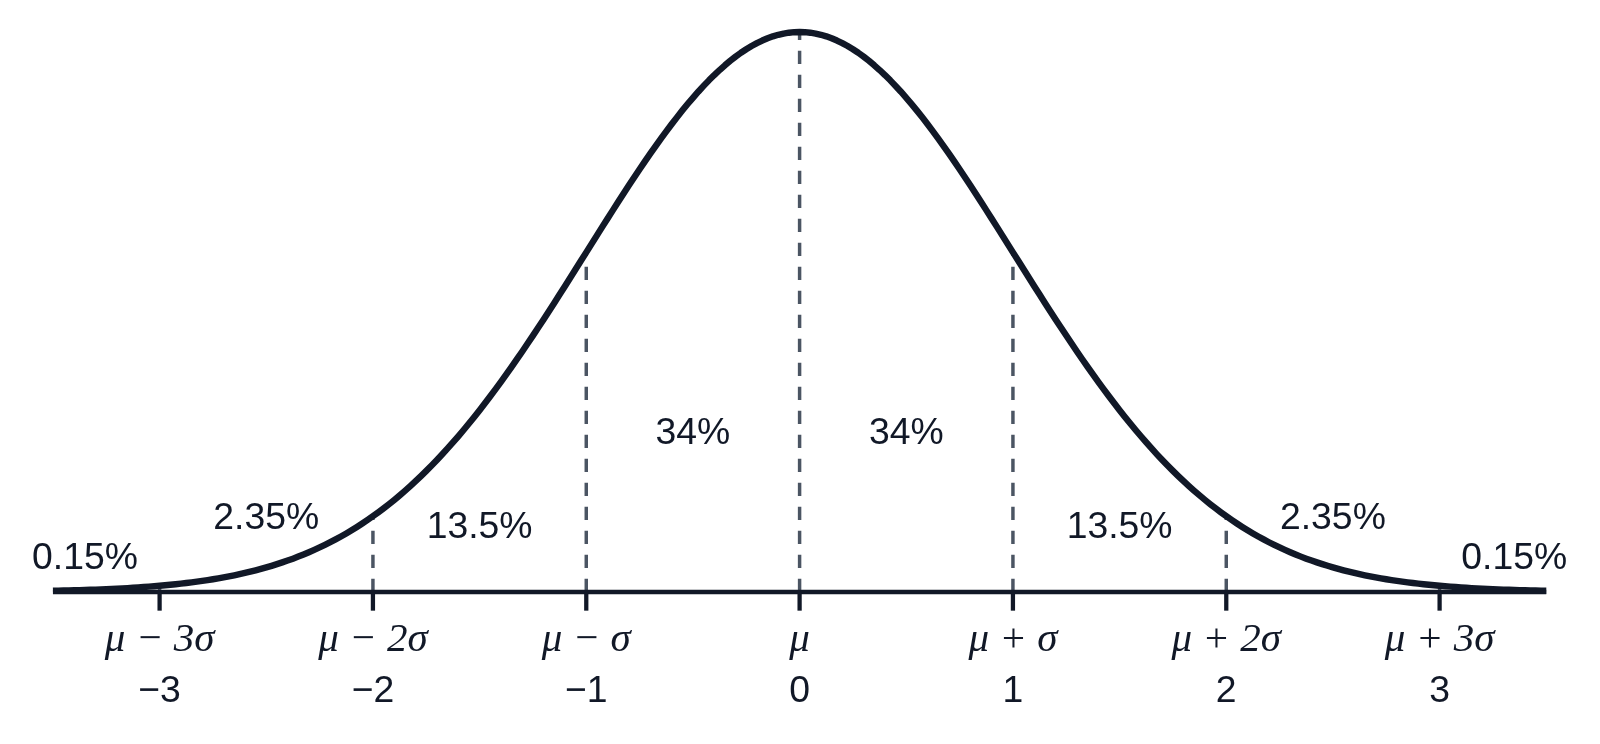
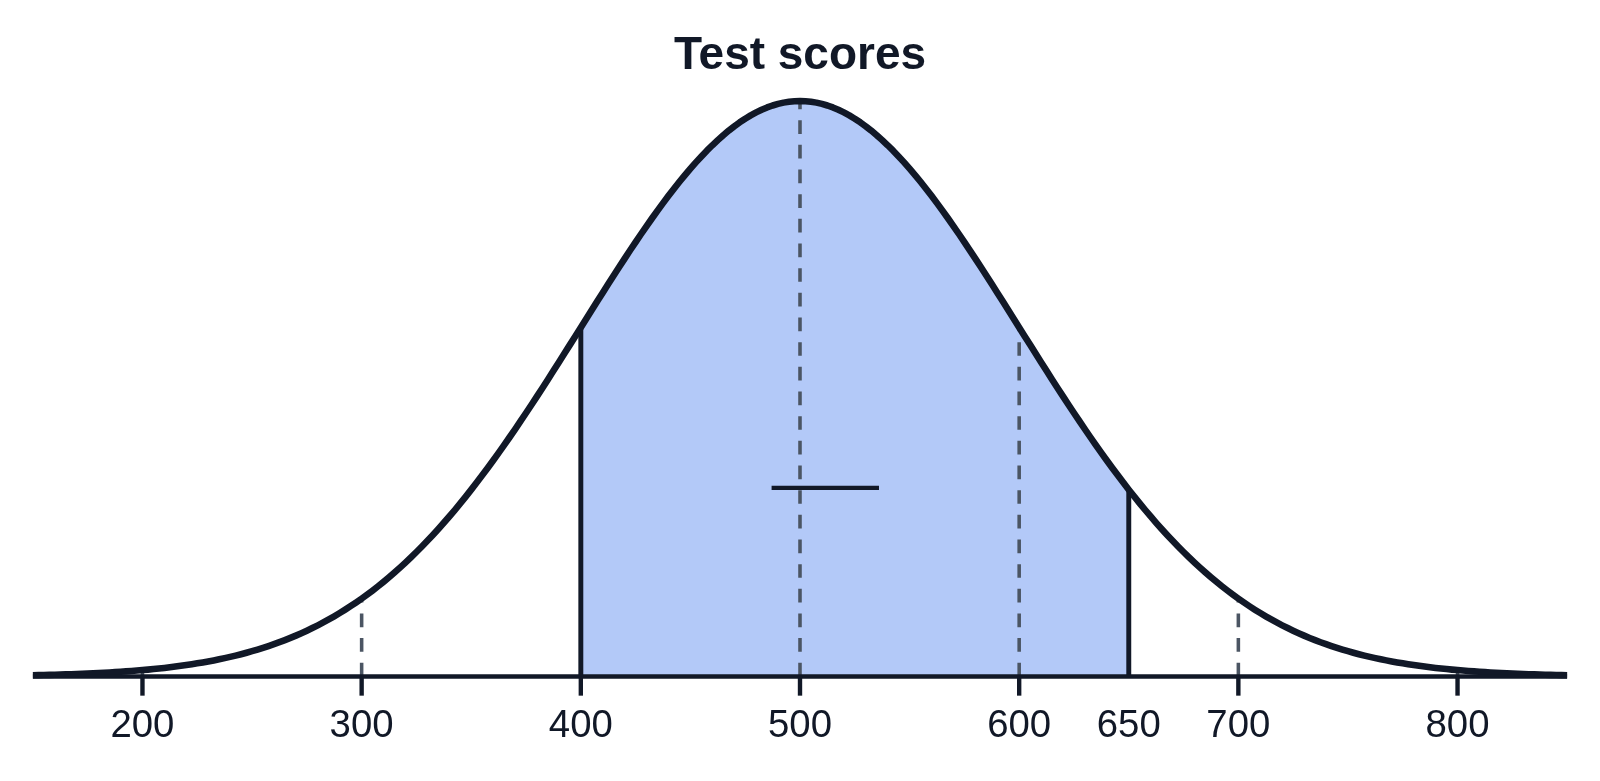
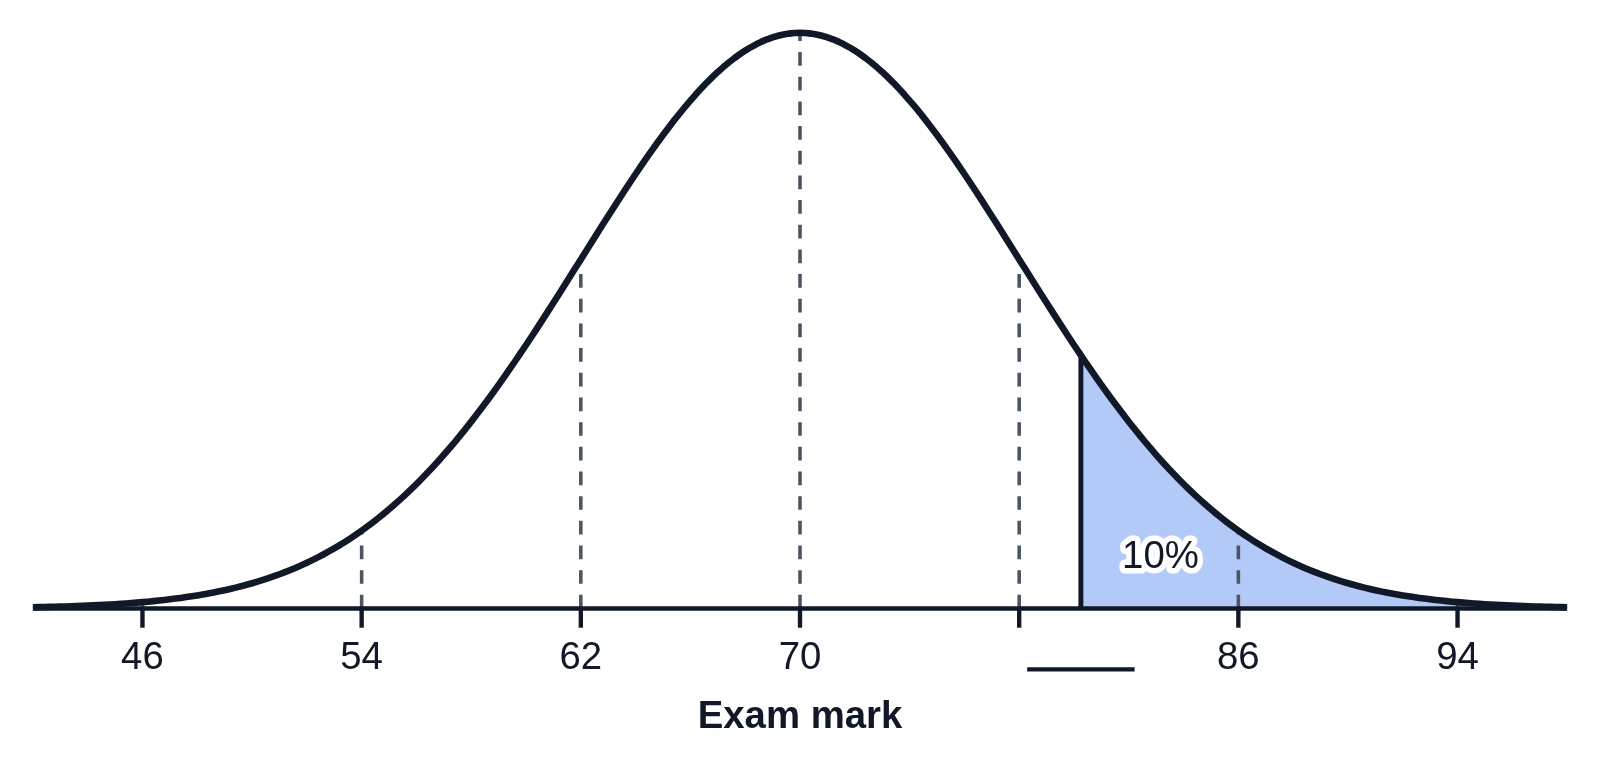
An example figure from the Normal Curve Generator.

A black-and-white standard normal curve with both tails beyond z = −1.96 and z = 1.96 shaded gray, each labeled 0.025
A standard normal curve in black and white with its axis numbered in z-scores from −3 to 3. Both tails are shaded with gray, left of z = −1.96 and right of z = 1.96, with the critical values written under the axis and each tail labeled 0.025, the 5% significance level split between the two tails of a two-tailed test.

Editing opens it in the Normal Curve Generator with these settings, to change anything and copy or download your own.

Free to use in your tests, worksheets, slides or anything else, no credit needed. Public domain under CC0 1.0. How to reuse our figures

More Normal Curve examples