Normal distribution: probability between two values

An example figure from the Normal Curve Generator.
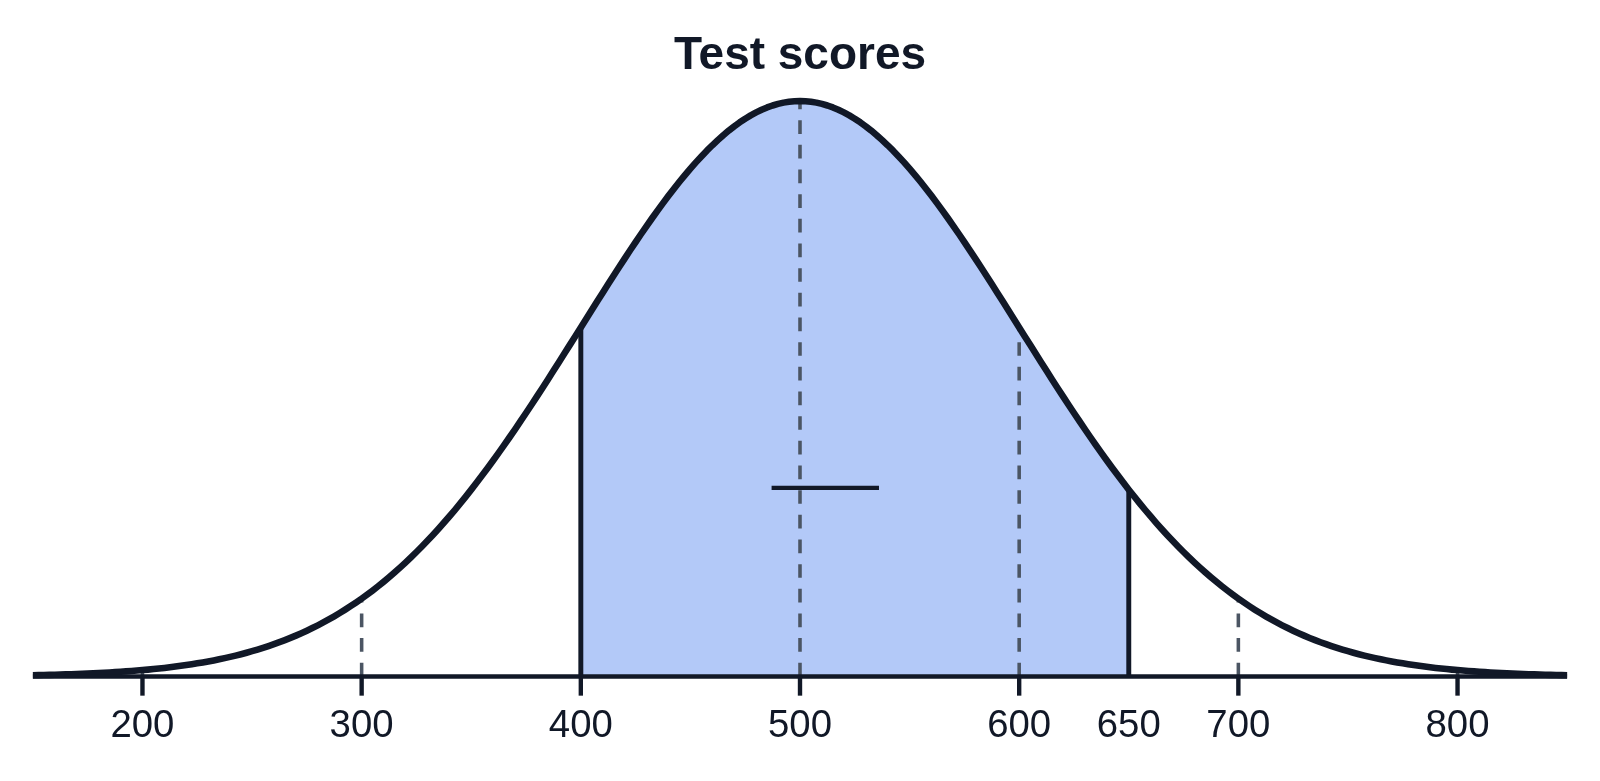
A normal curve of test scores with a mean of 500 and standard deviation of 100, the area between 400 and 650 shaded with a blank line on it for the probability
A normal curve titled Test scores, with a mean of 500 and standard deviation of 100, and ticks at 200, 300, 400, 500, 600, 700 and 800. The area between 400 and 650 is shaded blue and both bounds are written under the axis. A blank line on the shaded area is for students to write the probability that a score is between 400 and 650.

Editing opens it in the Normal Curve Generator with these settings, to change anything and copy or download your own.

Answer key

  • P(400 < X < 650) = 0.7745

Free to use in your tests, worksheets, slides or anything else, no credit needed. Public domain under CC0 1.0. How to reuse our figures
More Normal Curve examples