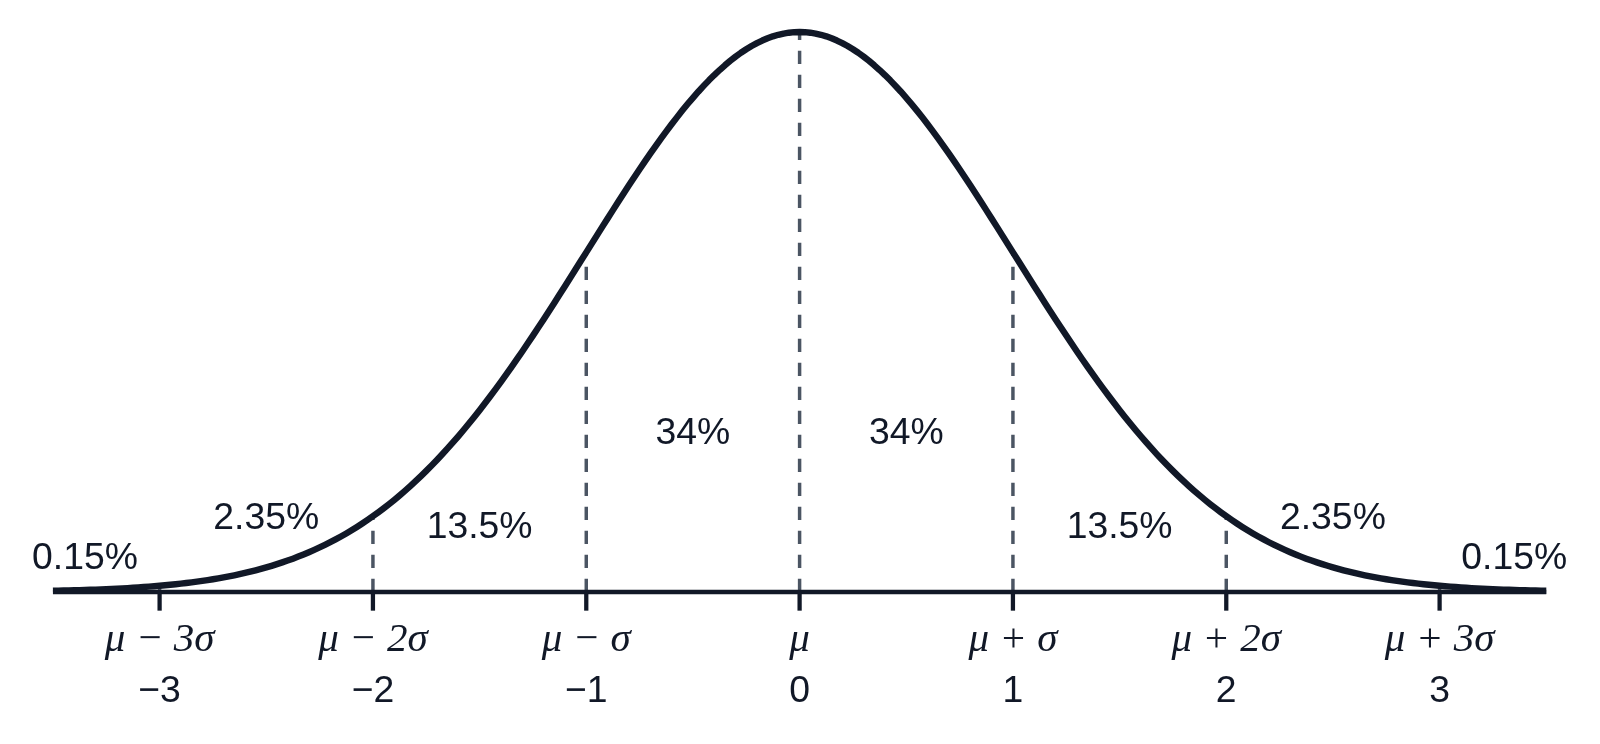
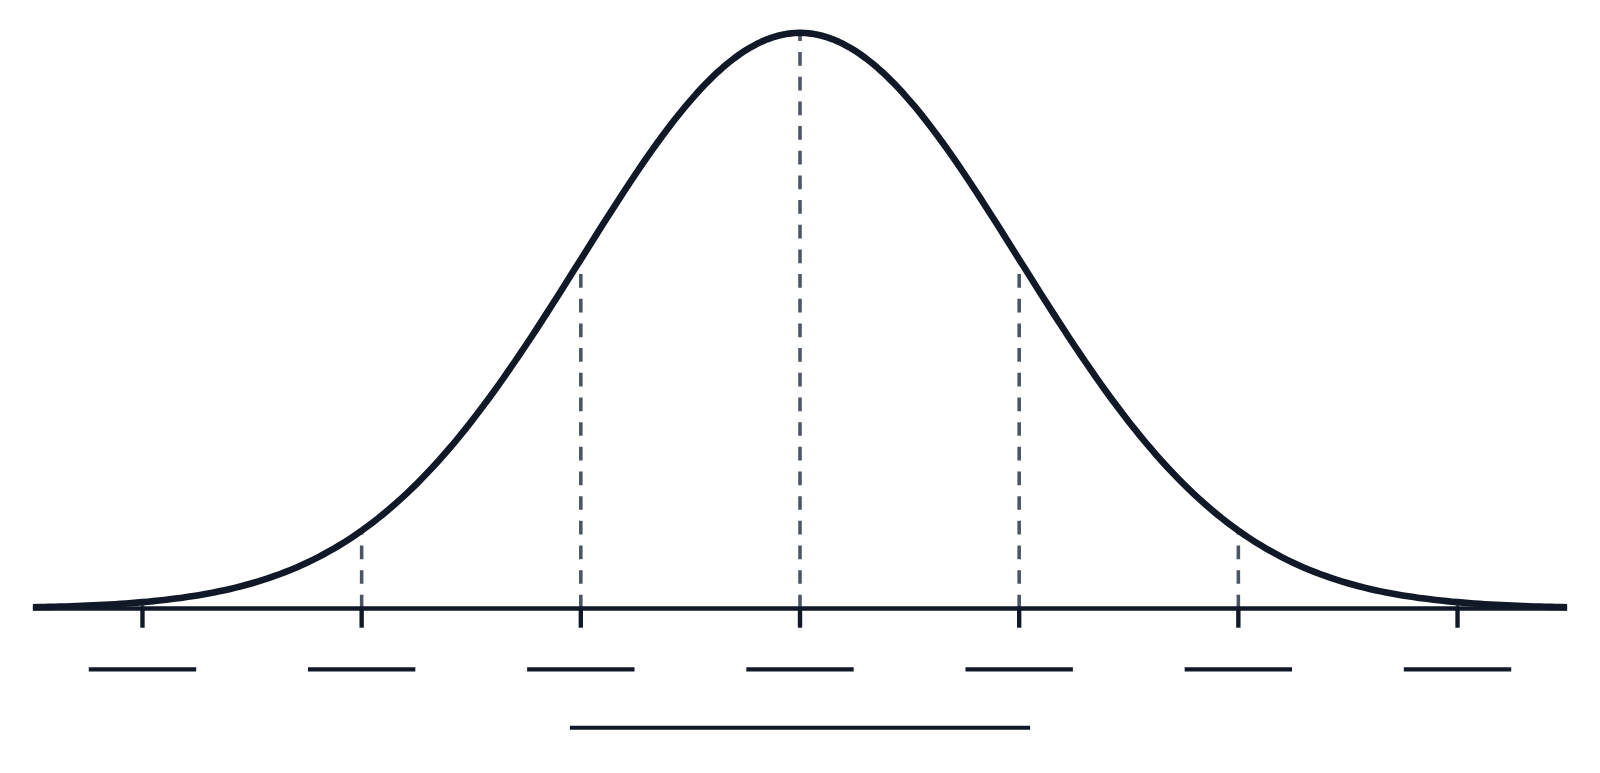
A normal curve with ticks at each standard deviation from the mean, labeled μ − 3σ, μ − 2σ, μ − σ, μ, μ + σ, μ + 2σ and μ + 3σ, with their z-scores from −3 to 3 under them. Dashed lines rise from each tick to the curve, and each section is labeled with its share of the area by the empirical rule: 34% either side of the mean, then 13.5%, 2.35%, and 0.15% in each tail.