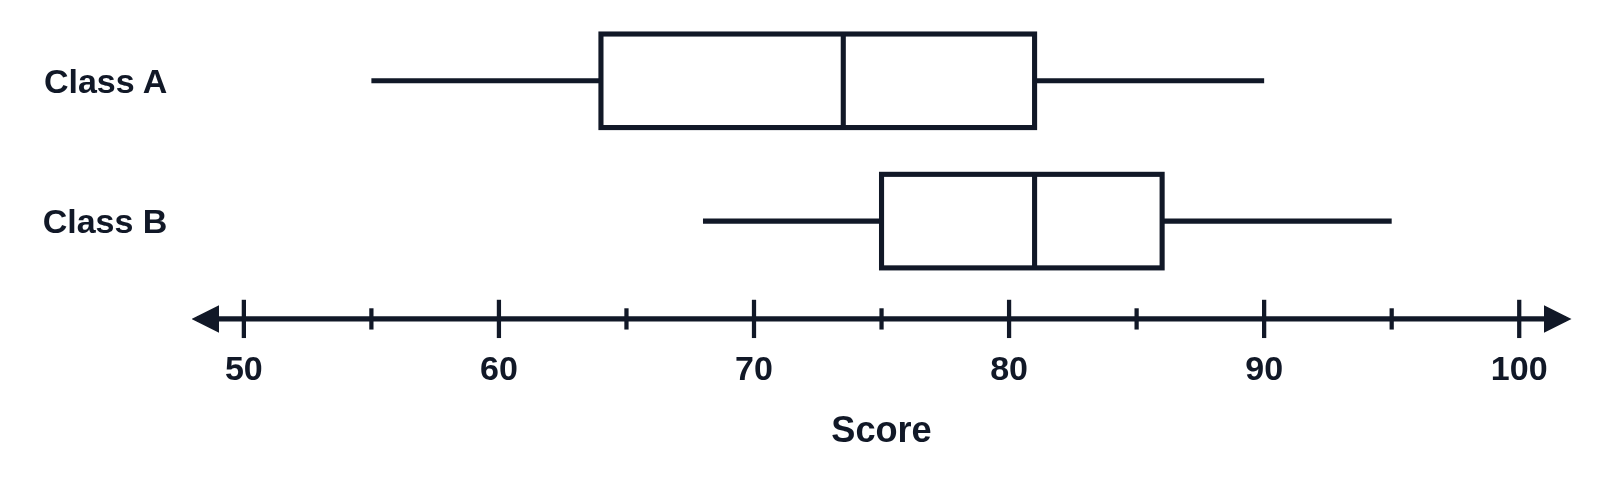
Comparing two box plots: Class A and Class B
An example figure from the Box Plot Generator.
Editing opens it in the Box Plot Generator with these settings, to change anything and copy or download your own.
Answer key
- Class A: Minimum 55 · Q1 64 · Median 73.5 · Q3 81 · Maximum 90 · IQR 17
- Class B: Minimum 68 · Q1 75 · Median 81 · Q3 86 · Maximum 95 · IQR 11
Free to use in your tests, worksheets, slides or anything else. Open source under Apache 2.0. How to reuse our figures