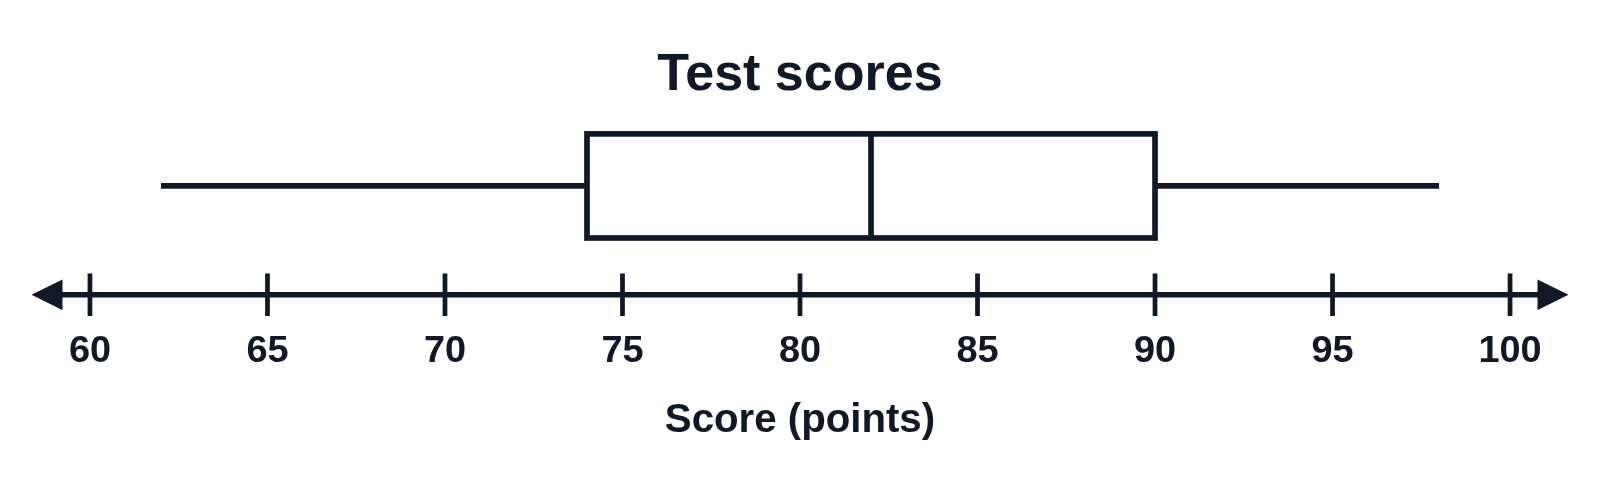
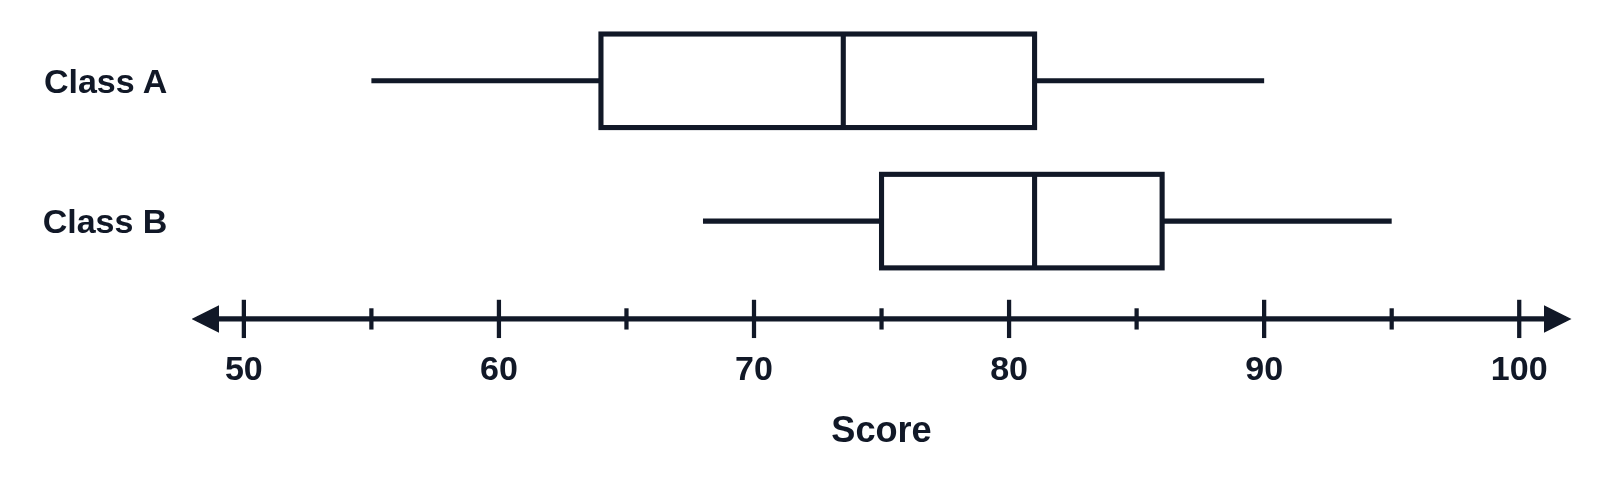
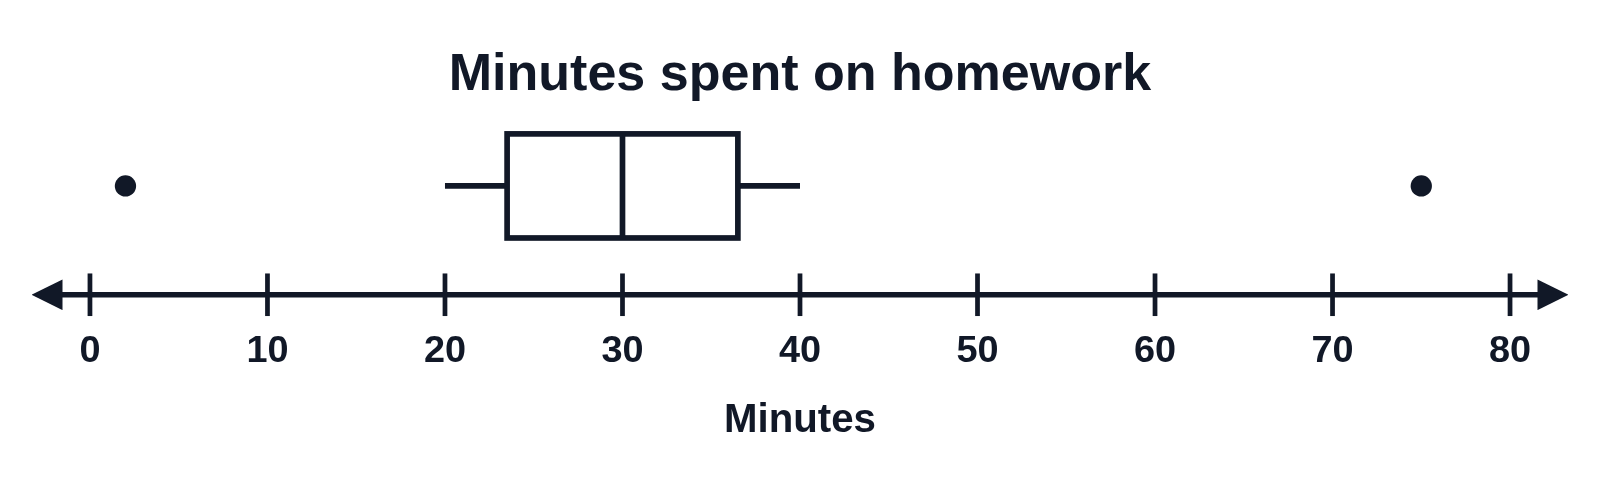
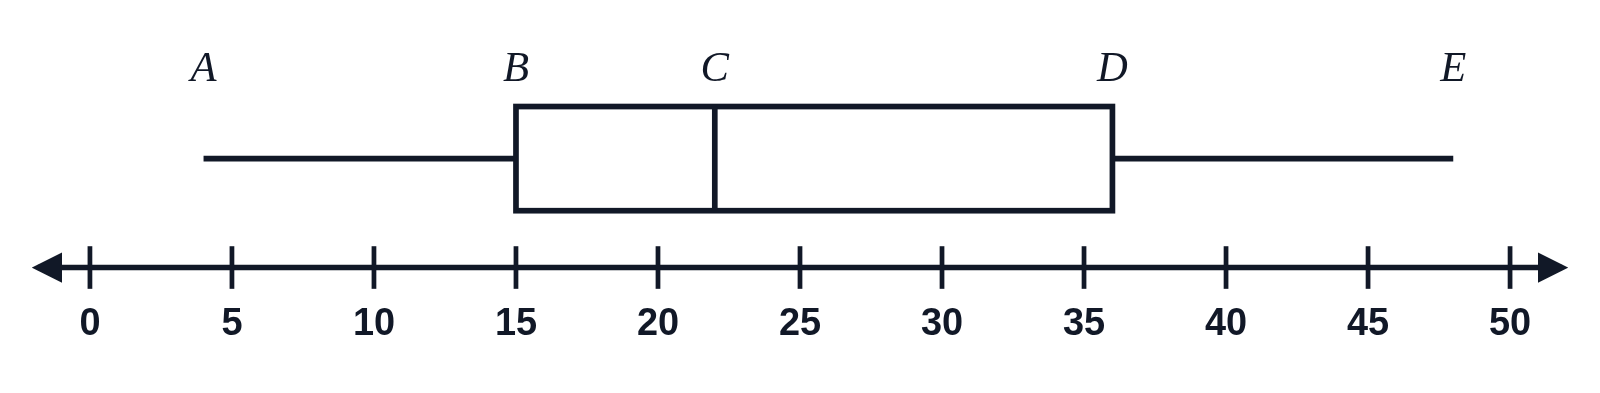
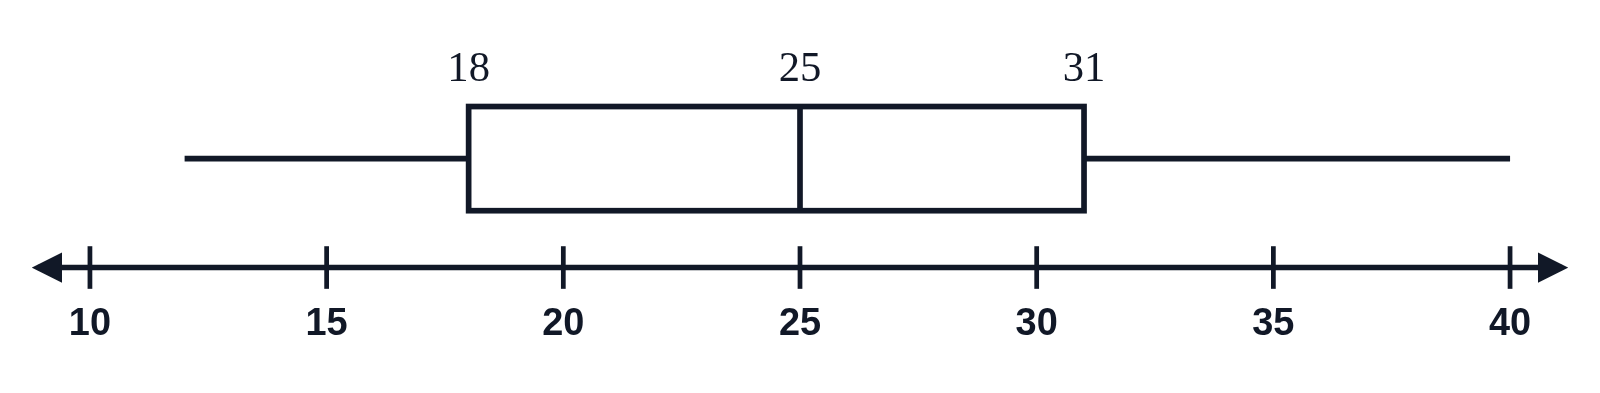
Box plot from a five-number summary, with Q1, the median and Q3 labeled
An example figure from the Box Plot Generator.
Editing opens it in the Box Plot Generator with these settings, to change anything and copy or download your own.
Answer key
- Minimum 12 · Q1 18 · Median 25 · Q3 31 · Maximum 40 · IQR 13
Free to use in your tests, worksheets, slides or anything else. Open source under Apache 2.0. How to reuse our figures