Box plot of test scores

An example figure from the Box Plot Generator.
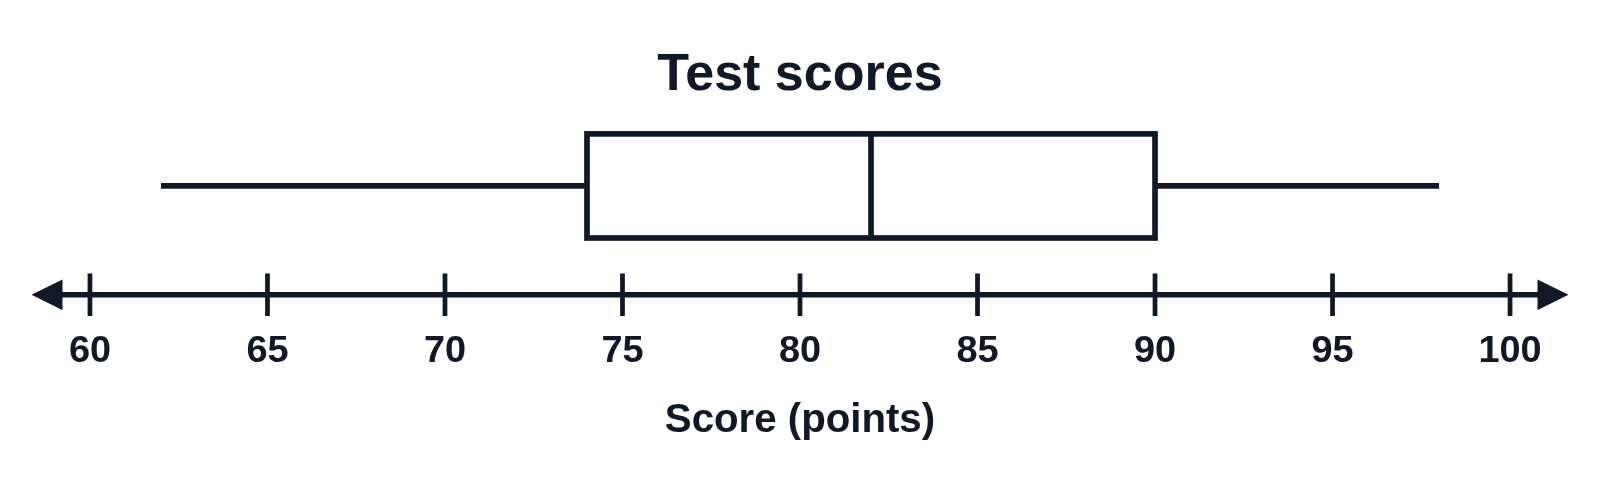
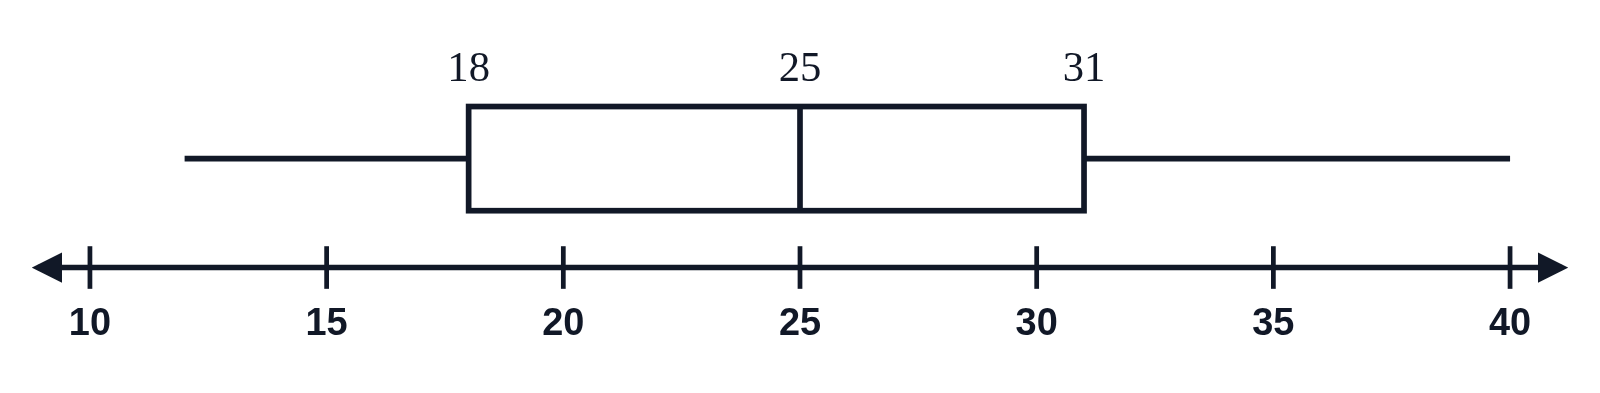
A box plot of 15 test scores titled Test scores, over a number line from 60 to 100 labeled Score (points)
A box plot of 15 test scores from 62 to 98, titled Test scores, over a number line from 60 to 100 numbered every 5 and titled Score (points). None of the five-number summary is written on it, so students read the minimum, quartiles, median and maximum from the line.

Editing opens it in the Box Plot Generator with these settings, to change anything and copy or download your own.

Answer key

  • Minimum 62 · Q1 74 · Median 82 · Q3 90 · Maximum 98 · IQR 16

Free to use in your tests, worksheets, slides or anything else. Open source under Apache 2.0. How to reuse our figures
More Box Plot examples