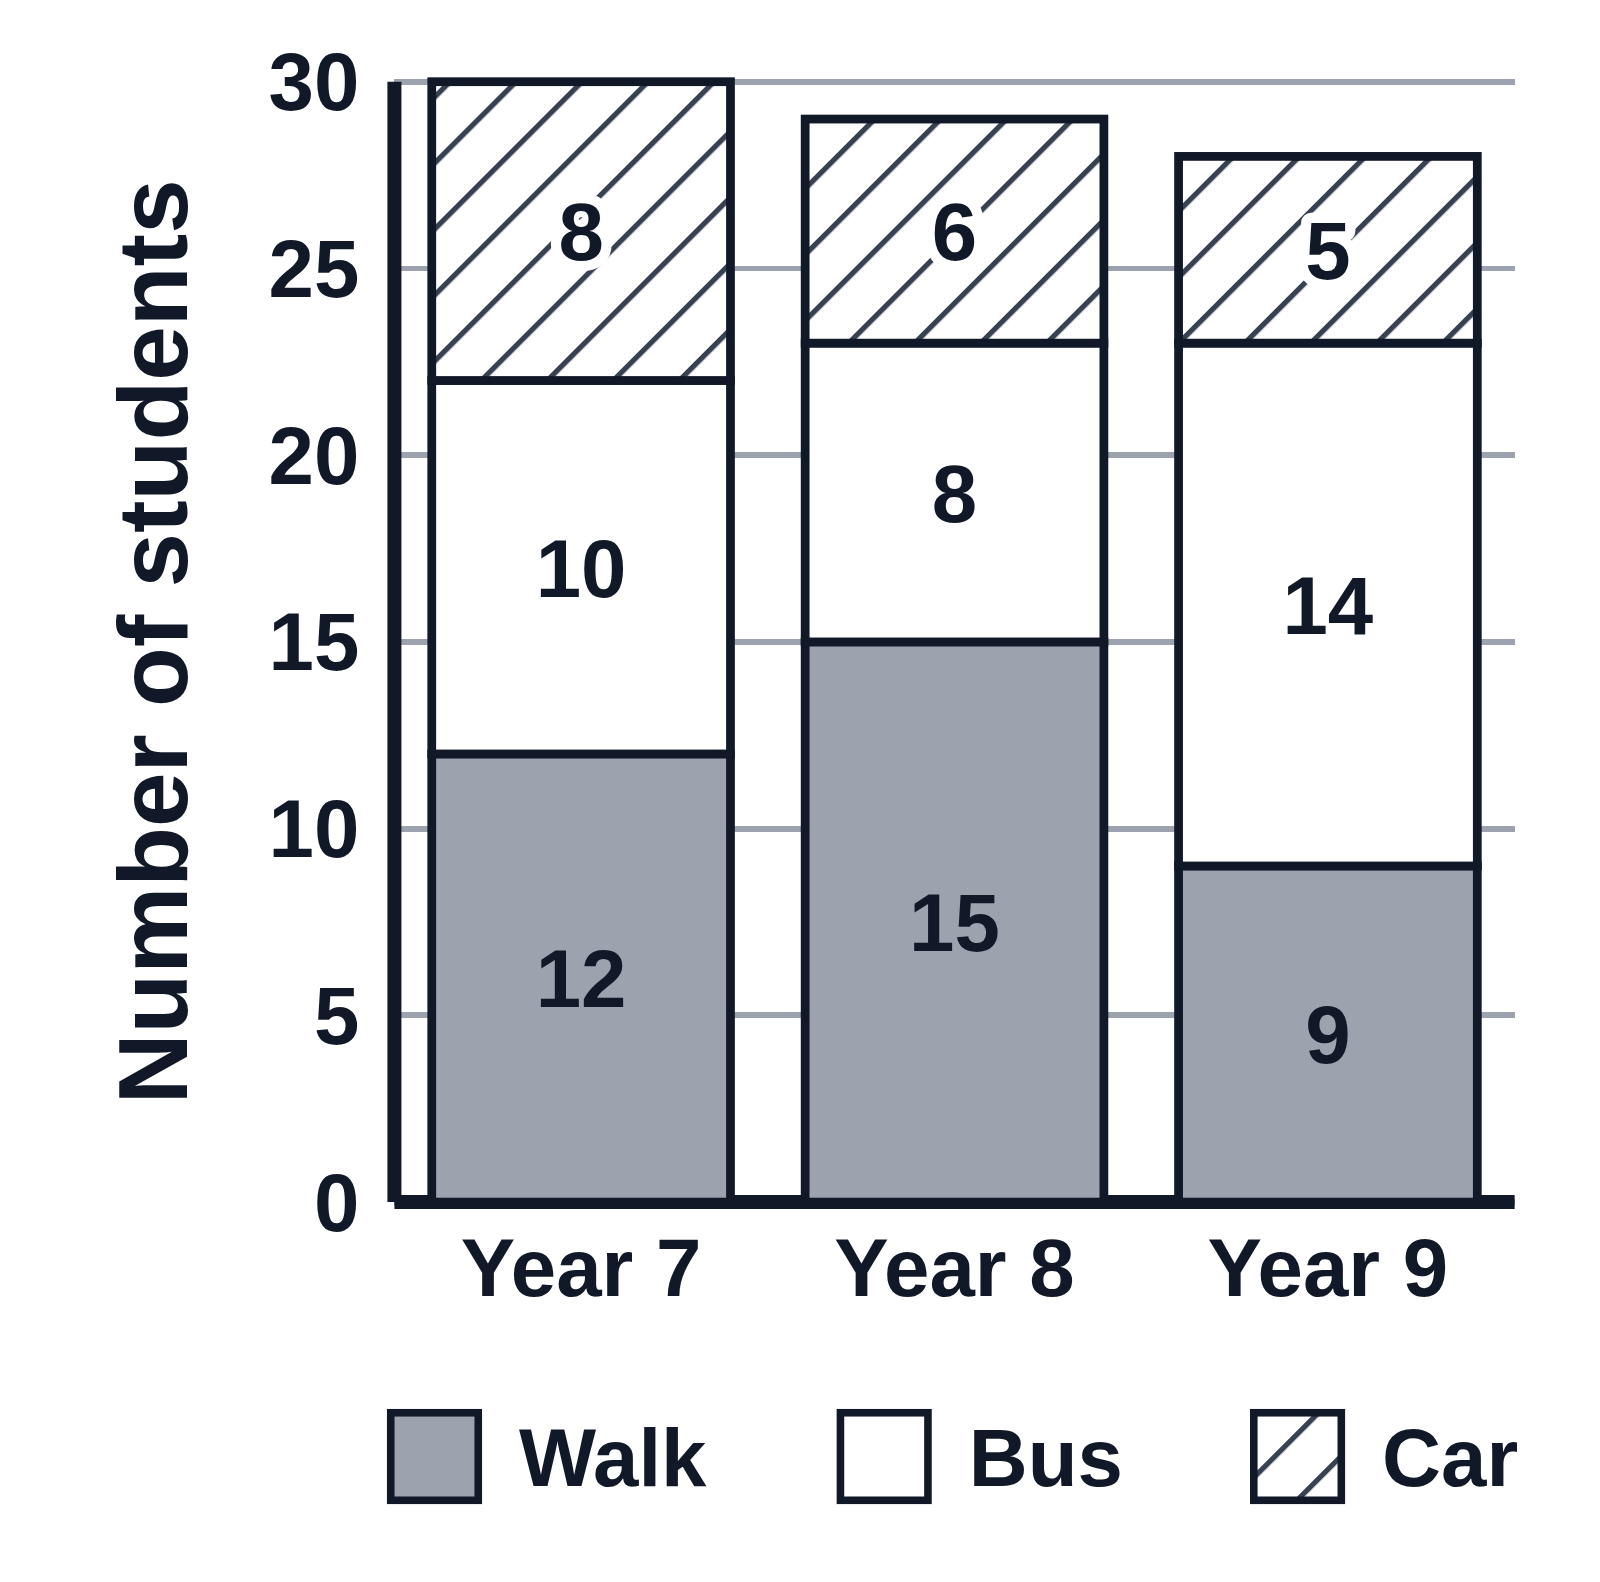
A stacked bar chart, also called a composite bar chart, of how students in Years 7, 8 and 9 travel to school. Each year’s column is split into Walk, Bus and Car in gray, white and hatching, named in a key below the graph, with the number in each part written inside it. Black-and-white fills keep the parts apart on a photocopy.