Bar graph with a bar left for students to draw

An example figure from the Bar Graph Generator.
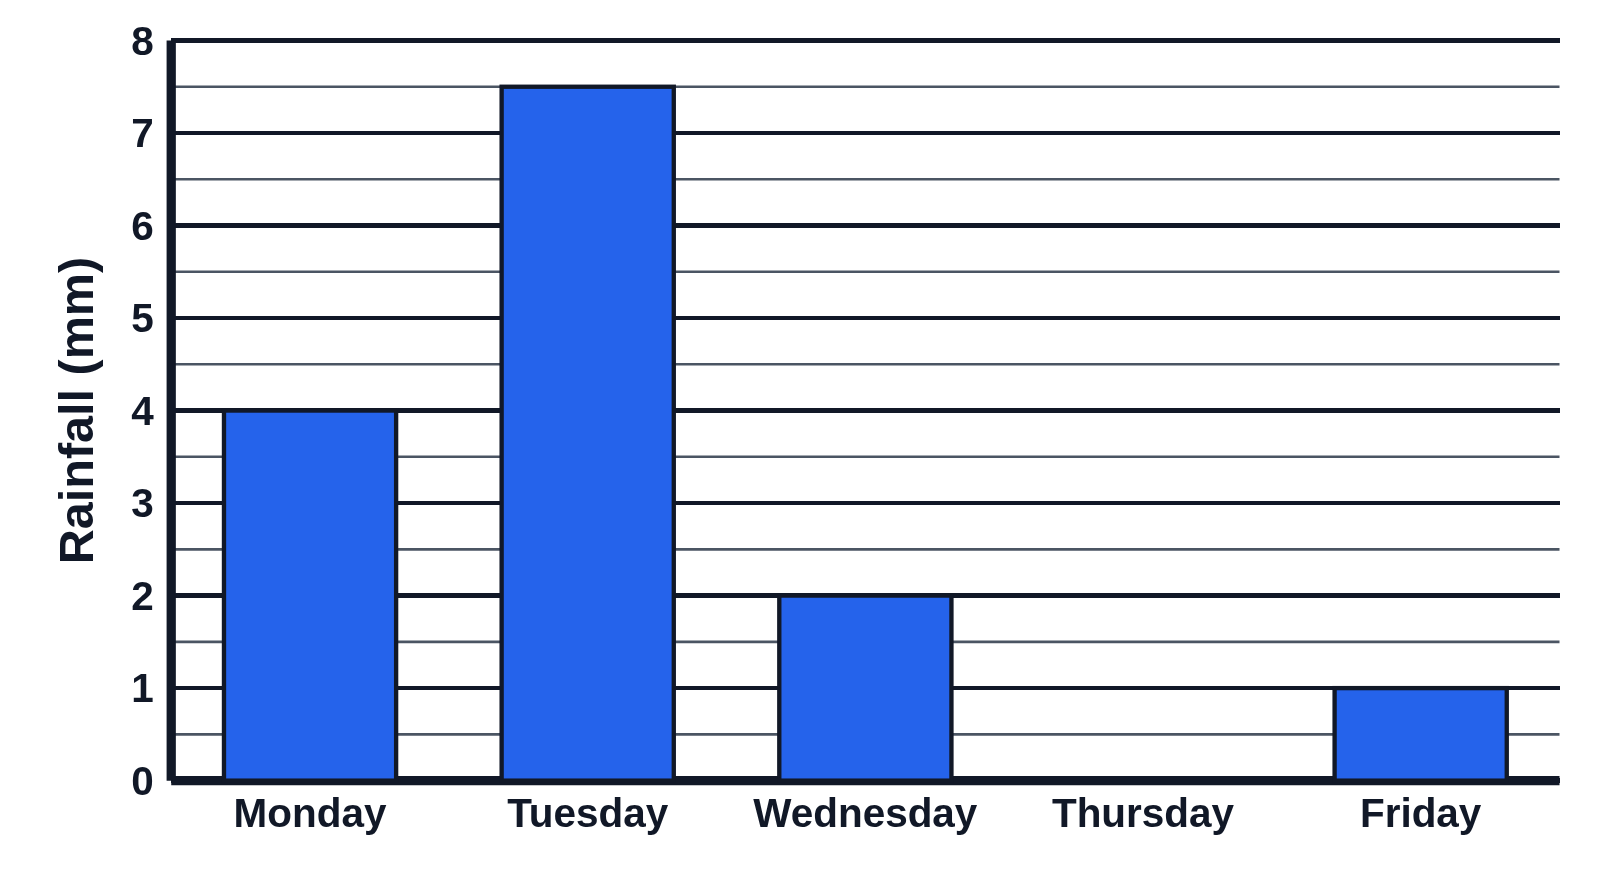
A bar graph of rainfall from Monday to Friday with Thursday’s bar missing, over bold gridlines with minor lines for drawing it
A bar graph of rainfall in millimeters from Monday to Friday with Thursday’s bar left off, so students draw it from a table or a description. Bold gridlines split into halves make the bar easy to draw to the nearest half millimeter, and the axis is titled Rainfall (mm).

Editing opens it in the Bar Graph Generator with these settings, to change anything and copy or download your own.

Free to use in your tests, worksheets, slides or anything else, no credit needed. Public domain under CC0 1.0. How to reuse our figures
More Bar Graph examples