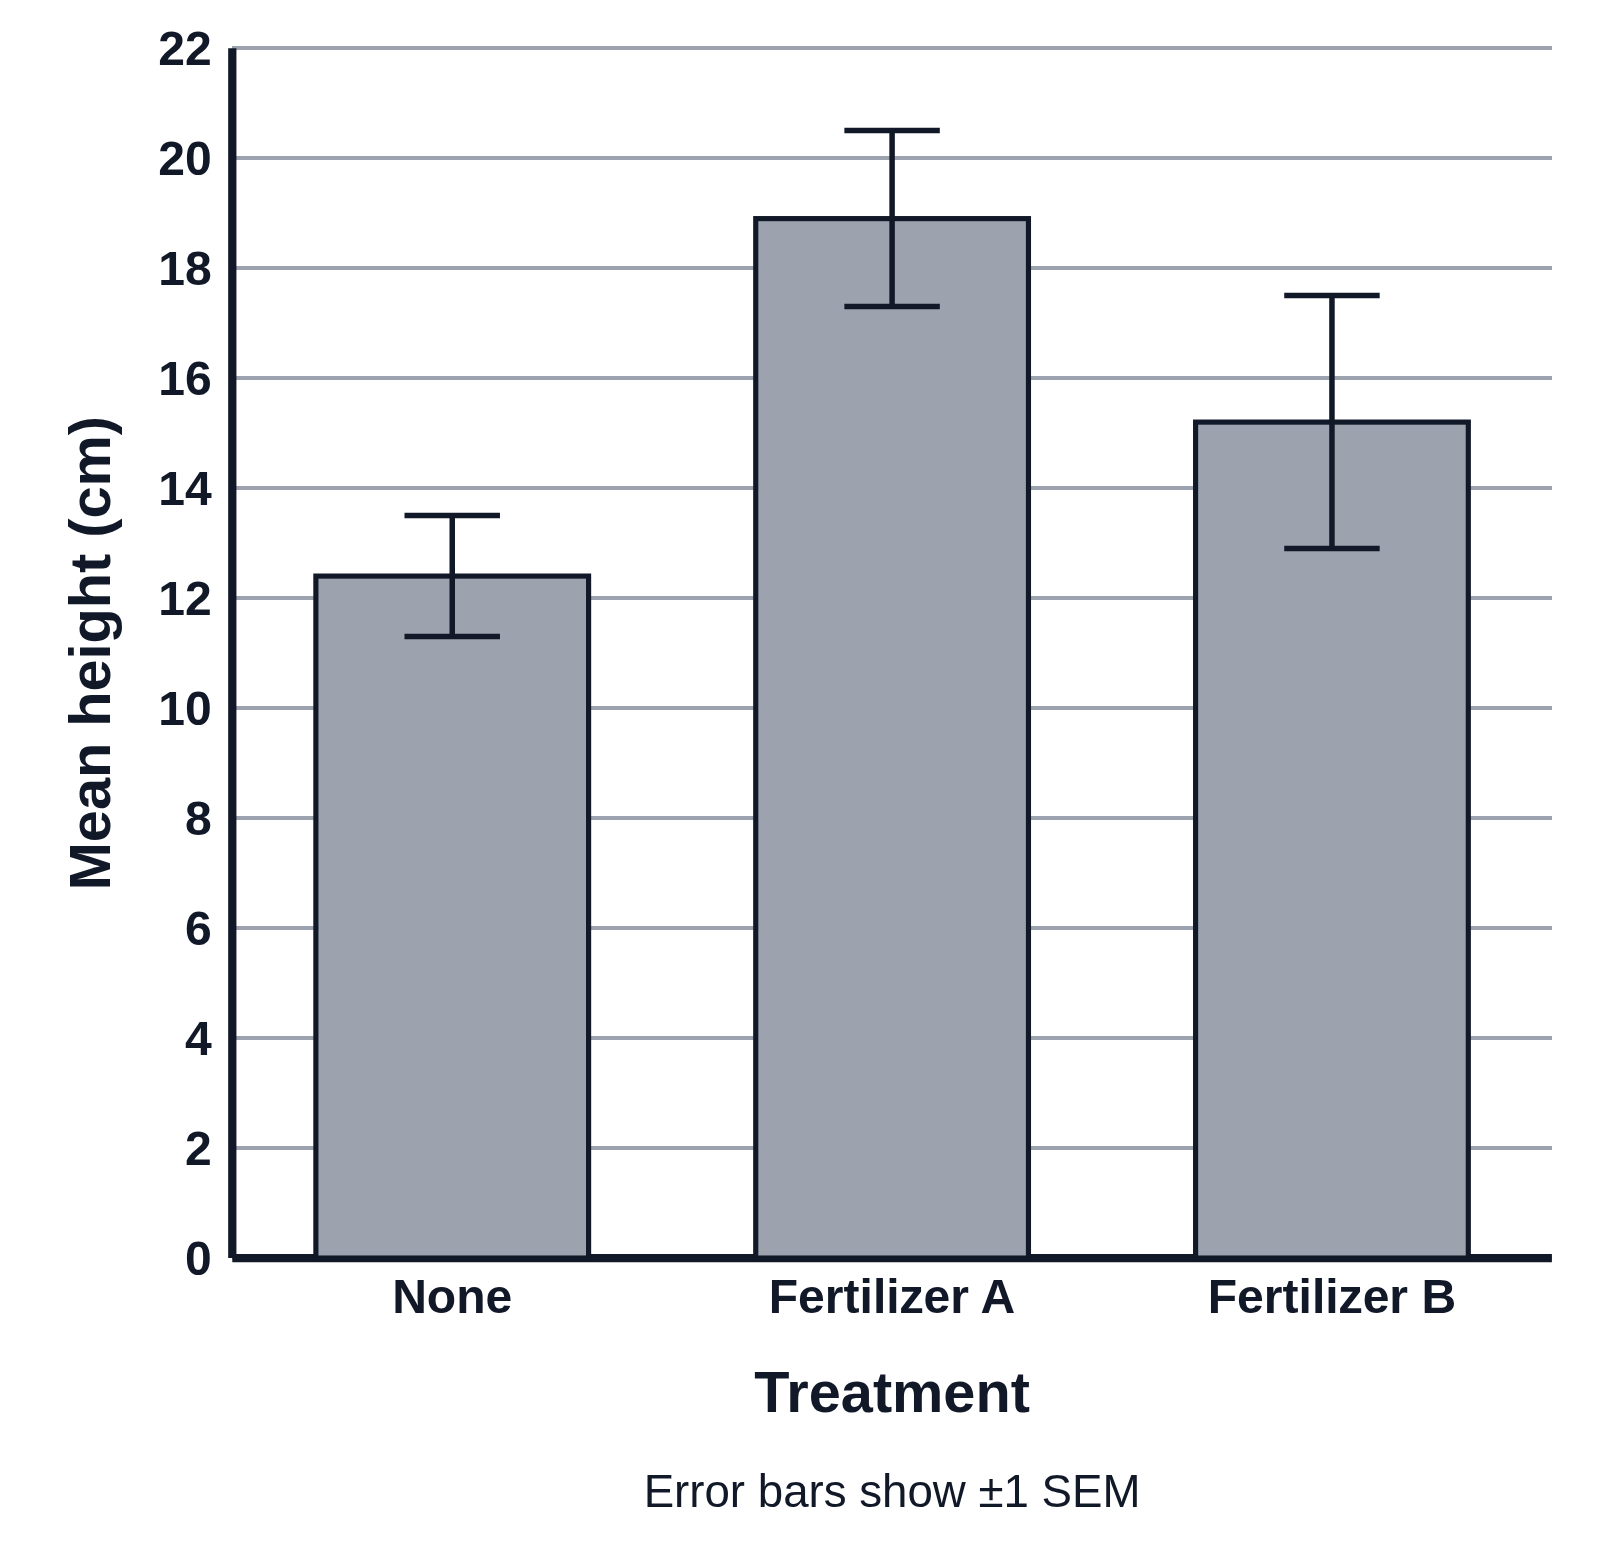
A bar graph of the mean height of plants given no fertilizer, fertilizer A and fertilizer B, in gray for printing, over an axis titled Mean height (cm). Each bar has an error bar with crossbars reaching one standard error of the mean above and below it, and the note under the graph says Error bars show ±1 SEM. Students judge whether the differences between the means are likely to be real.