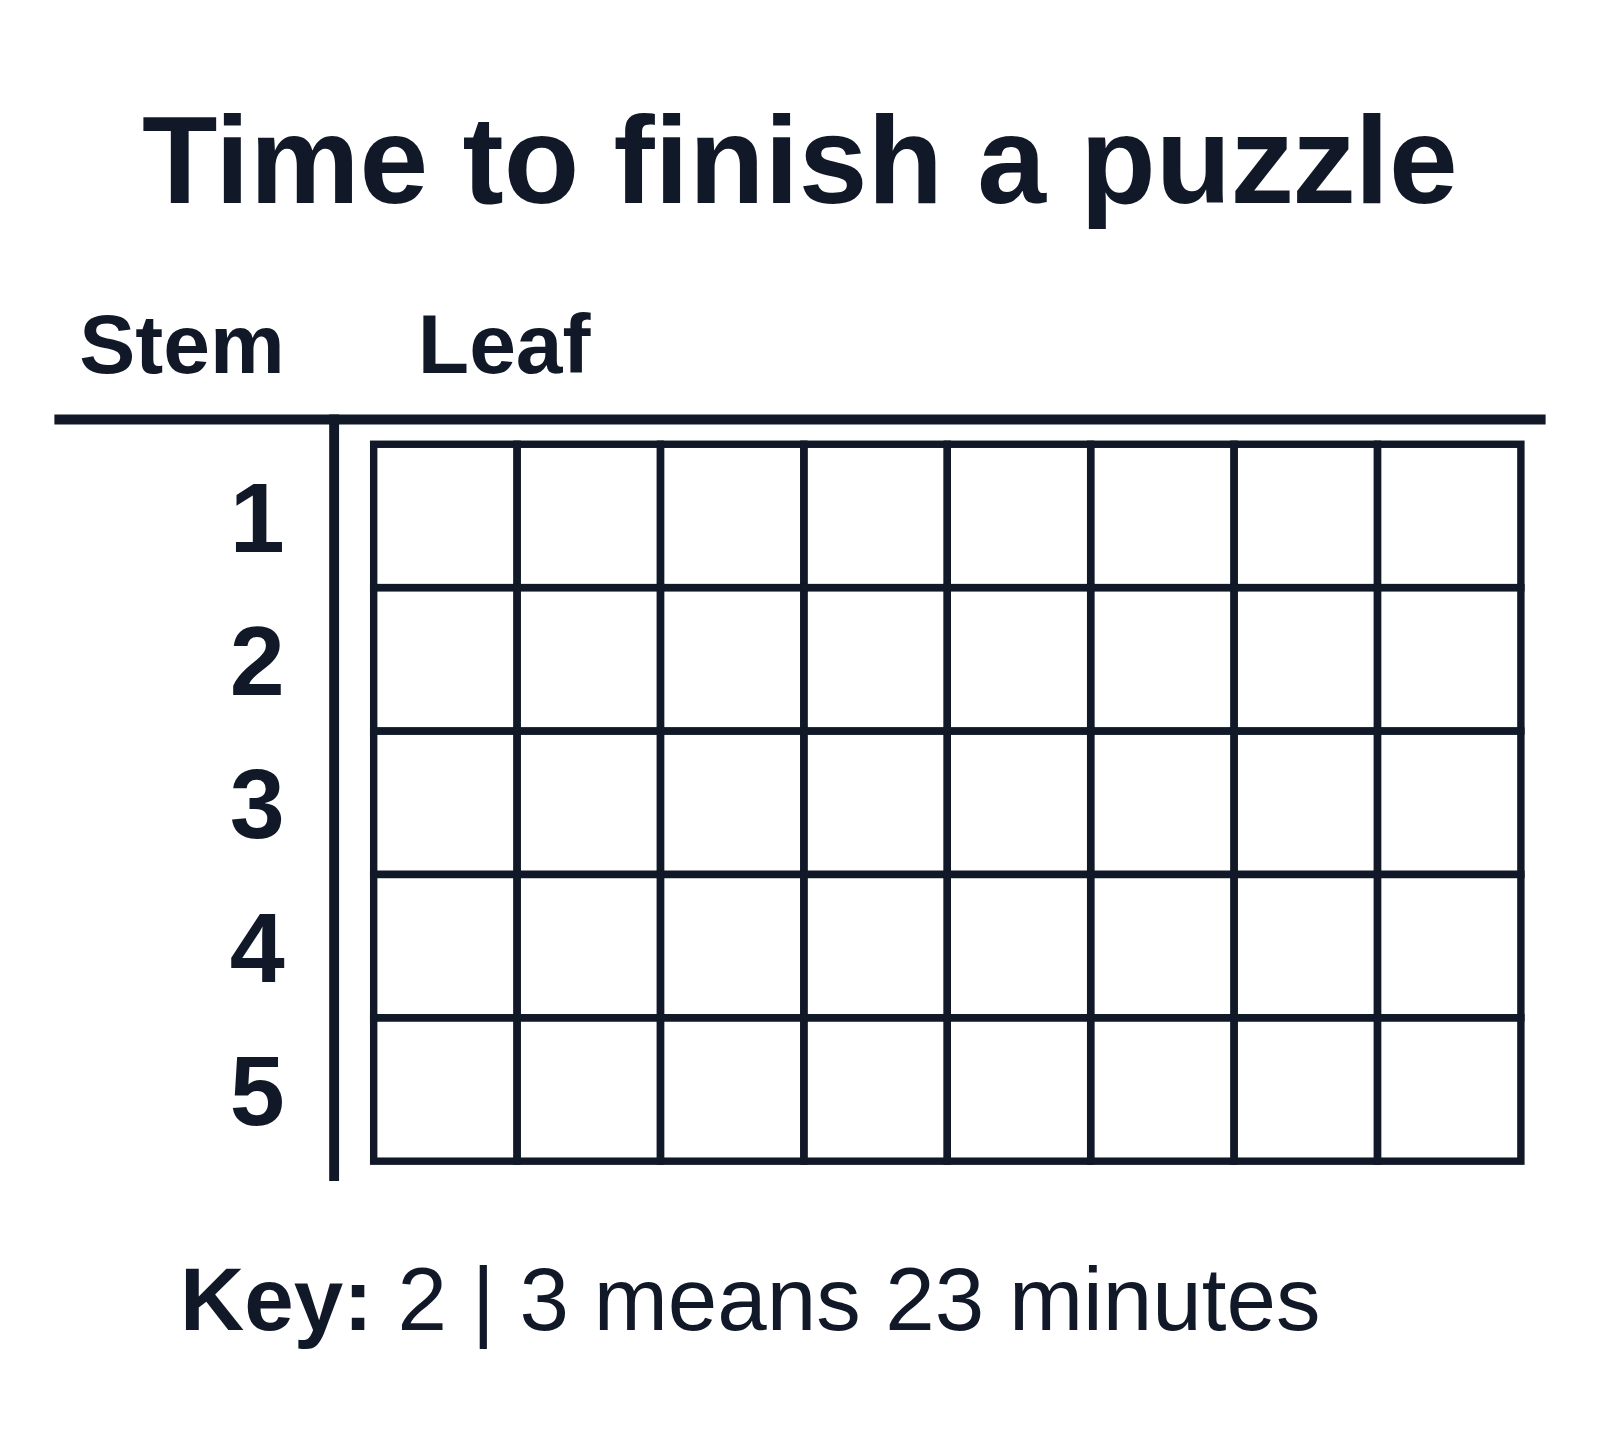
Stem-and-leaf plot with negative stems: temperatures
An example figure from the Stem-and-Leaf Plot Generator.
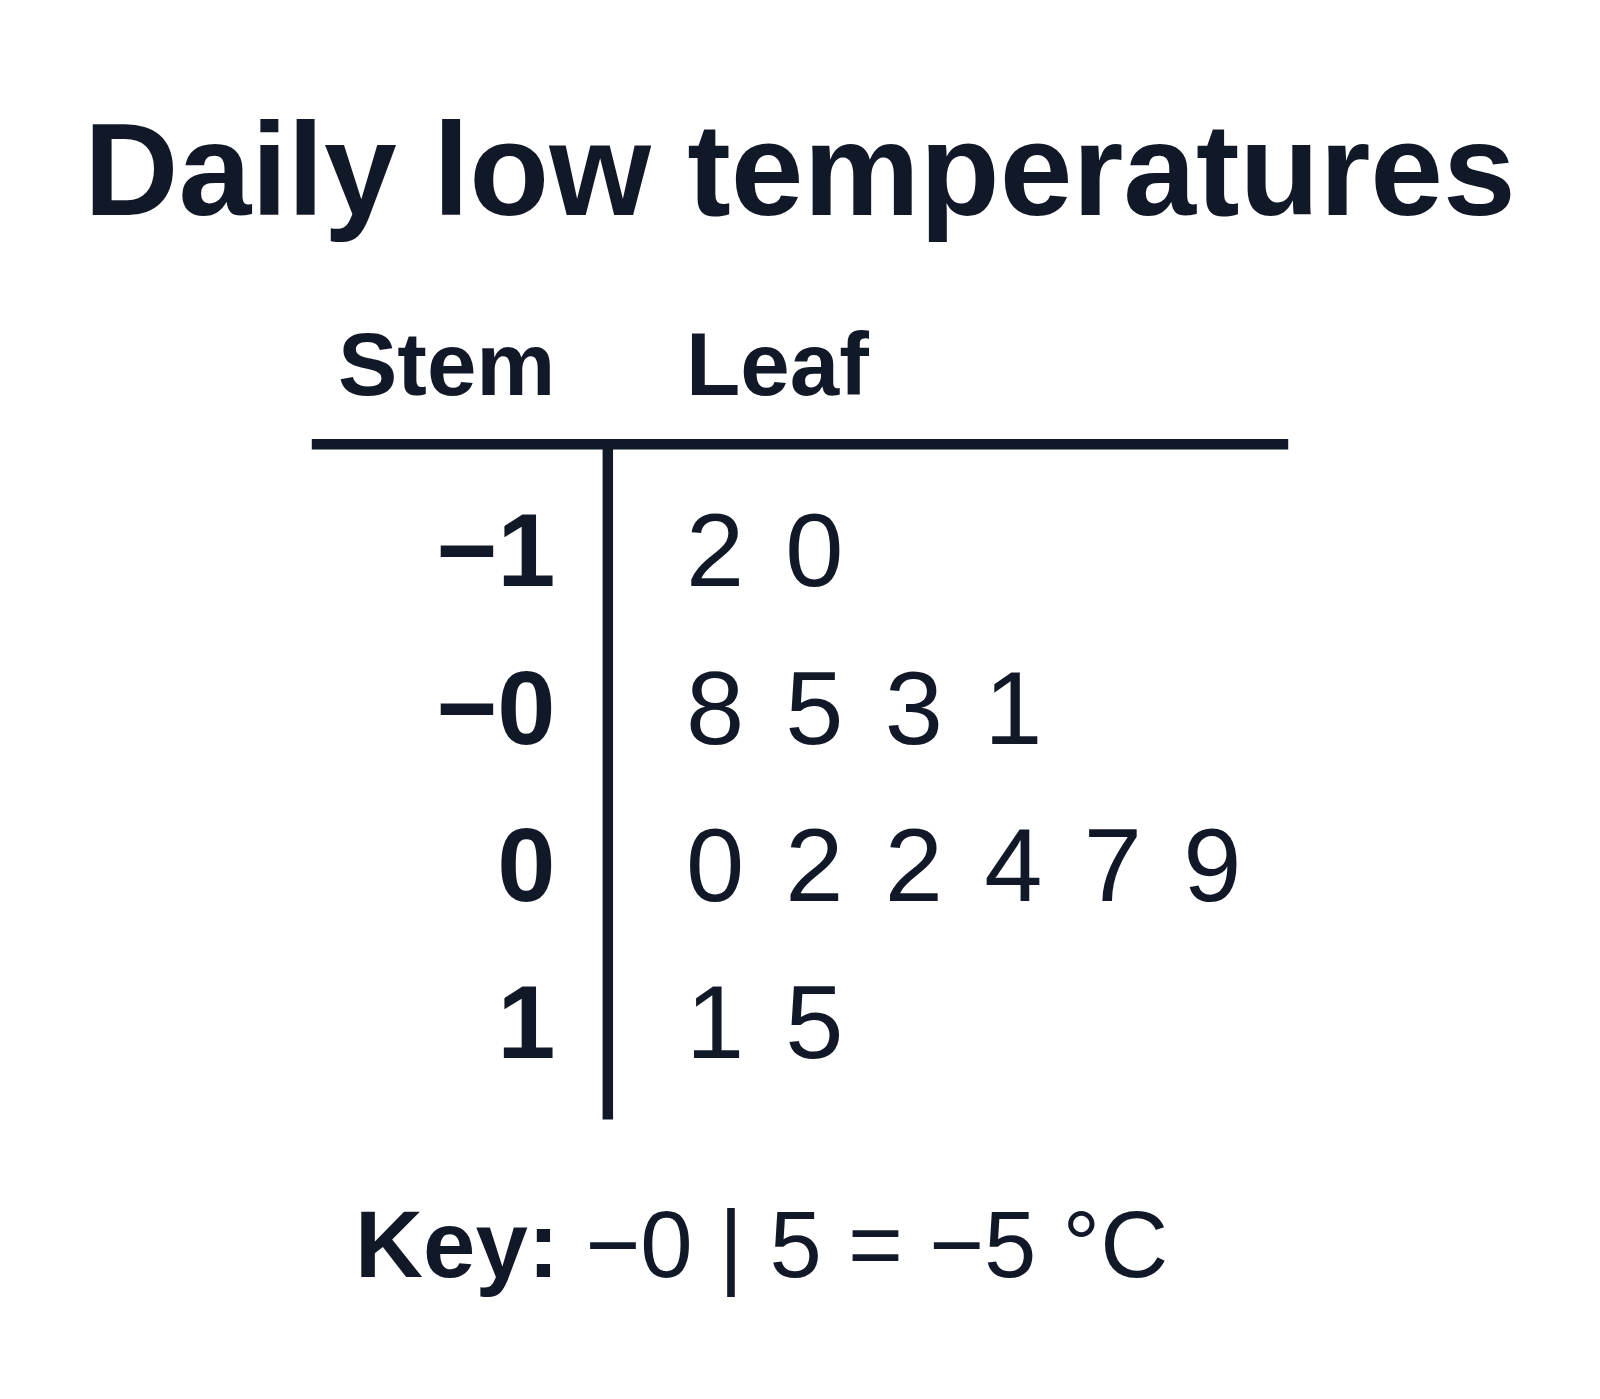
Editing opens it in the Stem-and-Leaf Plot Generator with these settings, to change anything and copy or download your own.
Answer key
- n 14 · Min −12 · Max 15 · Range 27 · Median 1 · Mode 2 · Q1 −5 · Q3 7
Free to use in your tests, worksheets, slides or anything else, no credit needed. Public domain under CC0 1.0. How to reuse our figures