Stem-and-leaf plot of test scores

An example figure from the Stem-and-Leaf Plot Generator.
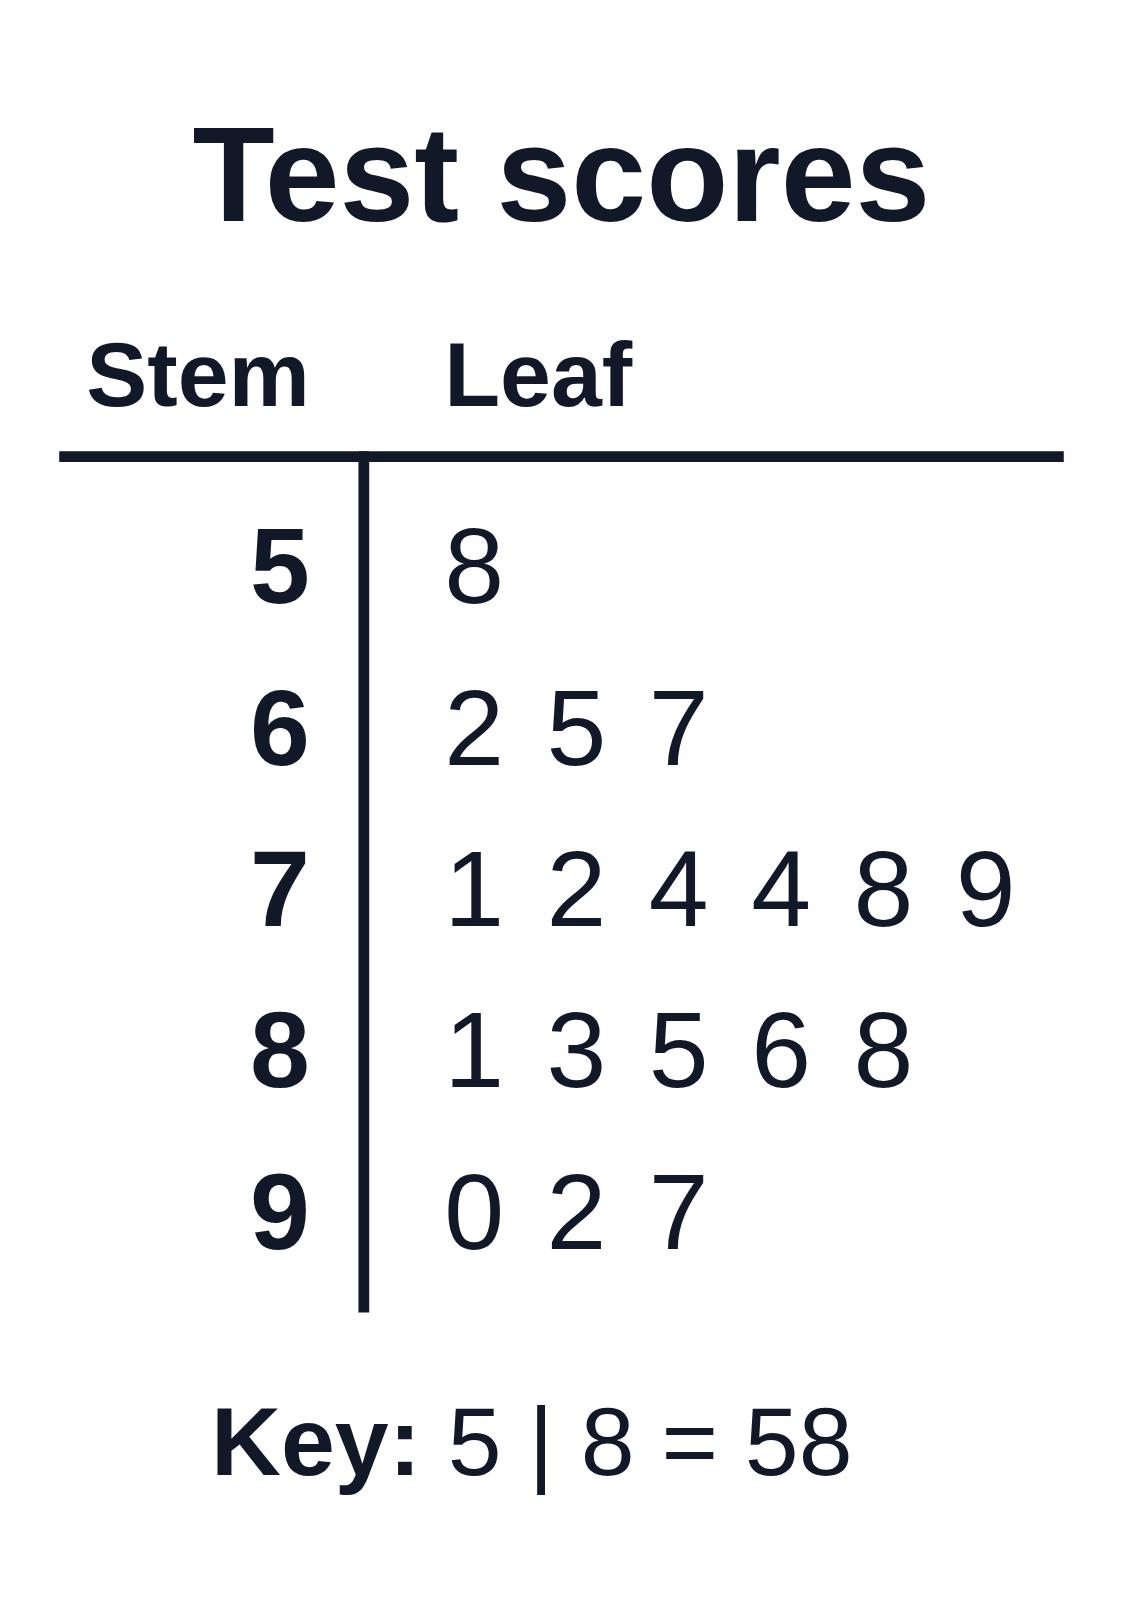
A stem-and-leaf plot titled Test scores with stems 5 to 9, the leaves in order, and the key 5 | 8 = 58
A stem-and-leaf plot titled Test scores, with the headings Stem and Leaf. The stems 5, 6, 7, 8 and 9 run down the left of a line, and each score’s last digit is written in order across its stem’s row, from 5 | 8 for 58 up to 9 | 0 2 7. The key under the plot reads 5 | 8 = 58. Students find the median, mode and range from it.

Editing opens it in the Stem-and-Leaf Plot Generator with these settings, to change anything and copy or download your own.

Answer key

  • n 18 · Min 58 · Max 97 · Range 39 · Median 78.5 · Mode 74 · Q1 71 · Q3 86

Free to use in your tests, worksheets, slides or anything else, no credit needed. Public domain under CC0 1.0. How to reuse our figures
More Stem-and-Leaf Plot examples