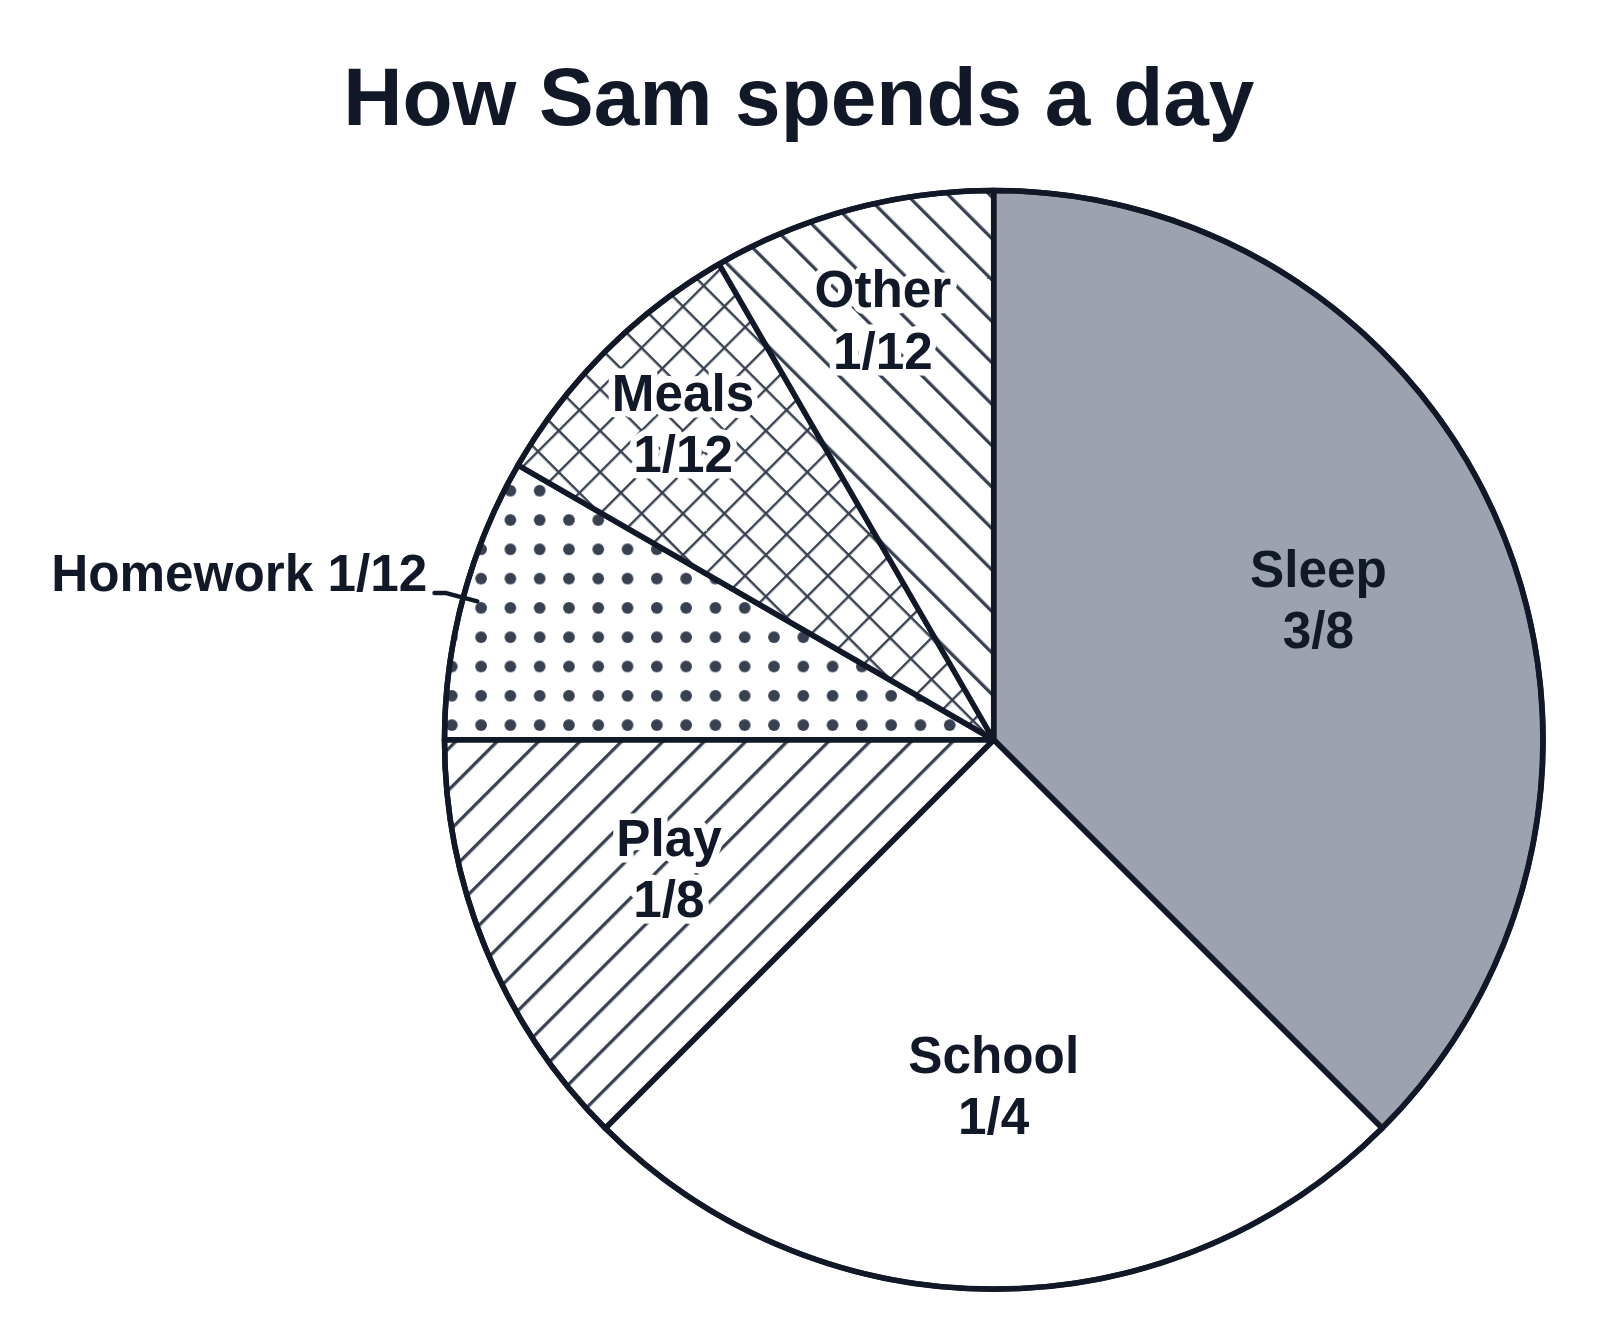
Pie chart with fractions: how Sam spends a day

An example figure from the Pie Chart Generator.

A black-and-white pie chart of how Sam spends 24 hours, each sector labeled with its activity and its fraction of the day
A black-and-white pie chart titled How Sam spends a day, with sectors in gray, white, hatching, dots, cross-hatching and back hatching for Sleep 3/8, School 1/4, Play 1/8, Homework 1/12, Meals 1/12 and Other 1/12. Each is labeled with its name and fraction of the day, inside its sector except Homework, which is labeled outside with a short leader line.

Editing opens it in the Pie Chart Generator with these settings, to change anything and copy or download your own.

Free to use in your tests, worksheets, slides or anything else, no credit needed. Public domain under CC0 1.0. How to reuse our figures

More Pie Chart examples