Circle graph of how students travel to school, with a key

An example figure from the Pie Chart Generator.
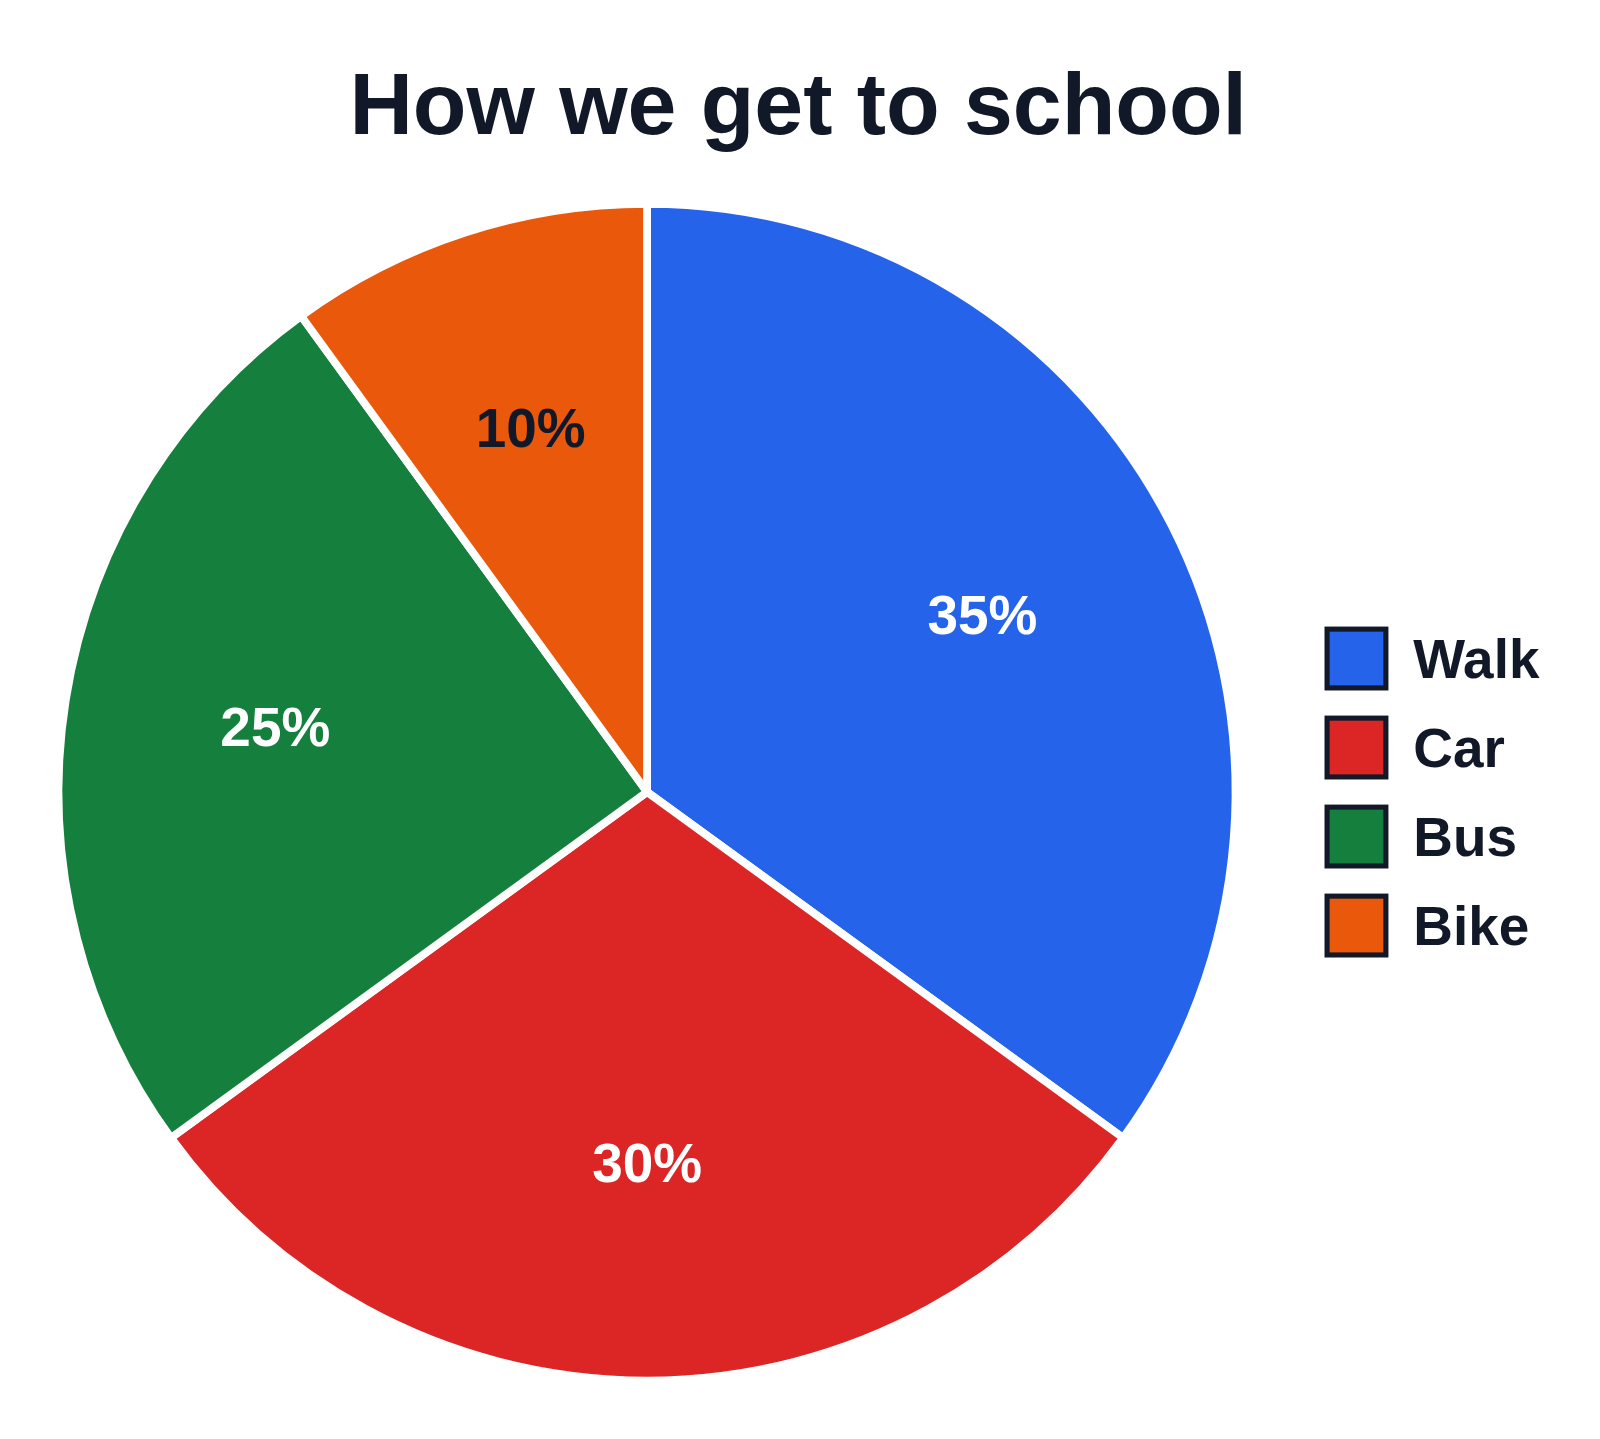
A circle graph of how students travel to school, each sector labeled with its percent, and a key on the right naming them
A circle graph titled How we get to school, with sectors for Walk, Car, Bus and Bike in blue, red, green and orange, clockwise from 12 o’clock. Each sector is labeled with its percent only, 35%, 30%, 25% and 10%, and a key on the right names the colors.

Editing opens it in the Pie Chart Generator with these settings, to change anything and copy or download your own.

Free to use in your tests, worksheets, slides or anything else, no credit needed. Public domain under CC0 1.0. How to reuse our figures
More Pie Chart examples