Line plot of number of pets, from a frequency table

An example figure from the Dot Plot Generator.
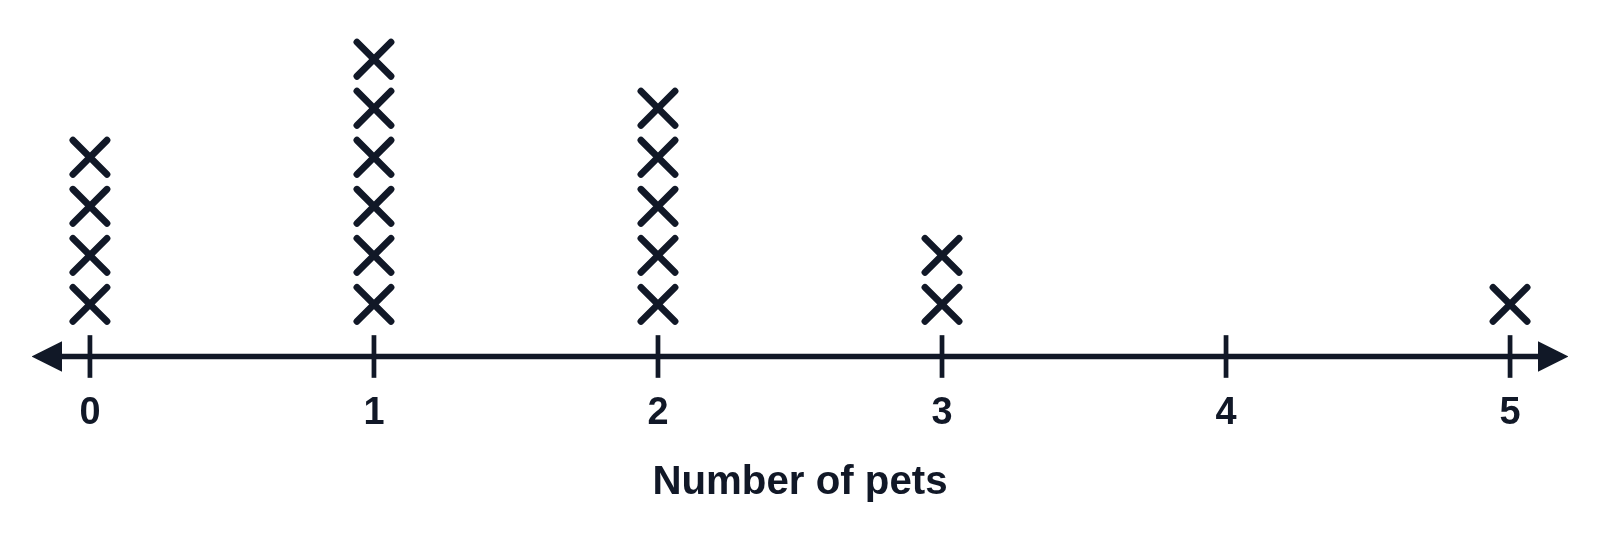
A line plot with X’s stacked over 0 to 5 on a number line titled Number of pets: four over 0, six over 1, five over 2, two over 3, none over 4 and one over 5
A line plot of how many pets 18 students have, made from a frequency table, with an X for each student stacked over a number line from 0 to 5 titled Number of pets. There are four X’s over 0, six over 1, five over 2, two over 3, none over 4 and one over 5.

Editing opens it in the Dot Plot Generator with these settings, to change anything and copy or download your own.

Answer key

  • Number of values: 18
  • Mode: 1 (6 times)
  • Median: 1
  • Range: 5 (from 0 to 5)

Free to use in your tests, worksheets, slides or anything else, no credit needed. Public domain under CC0 1.0. How to reuse our figures
More Dot Plot examples