Dot plot of hours of sleep

An example figure from the Dot Plot Generator.
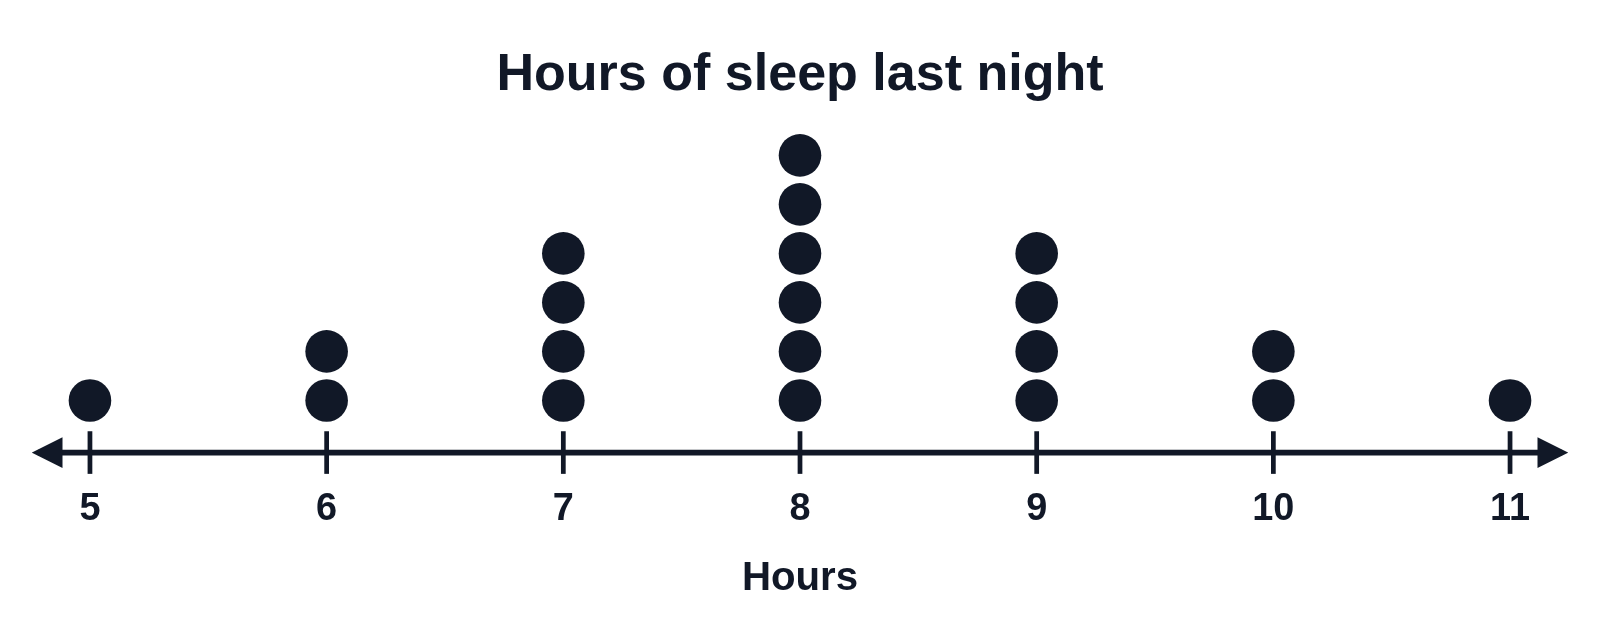
A dot plot of 20 students’ hours of sleep, titled Hours of sleep last night, with dots stacked over a number line from 5 to 11
A dot plot of 20 students’ hours of sleep last night, with one dot per student stacked over a number line from 5 to 11 numbered every hour and titled Hours. The tallest column, over 8, has six dots. Students read the mode, median and range, or describe the shape of the data.

Editing opens it in the Dot Plot Generator with these settings, to change anything and copy or download your own.

Answer key

  • Number of values: 20
  • Mode: 8 (6 times)
  • Median: 8
  • Range: 6 (from 5 to 11)

Free to use in your tests, worksheets, slides or anything else, no credit needed. Public domain under CC0 1.0. How to reuse our figures
More Dot Plot examples