
Conditional relative frequency table: favorite sport by grade, in row percents
An example figure from the Two-Way Table Generator.
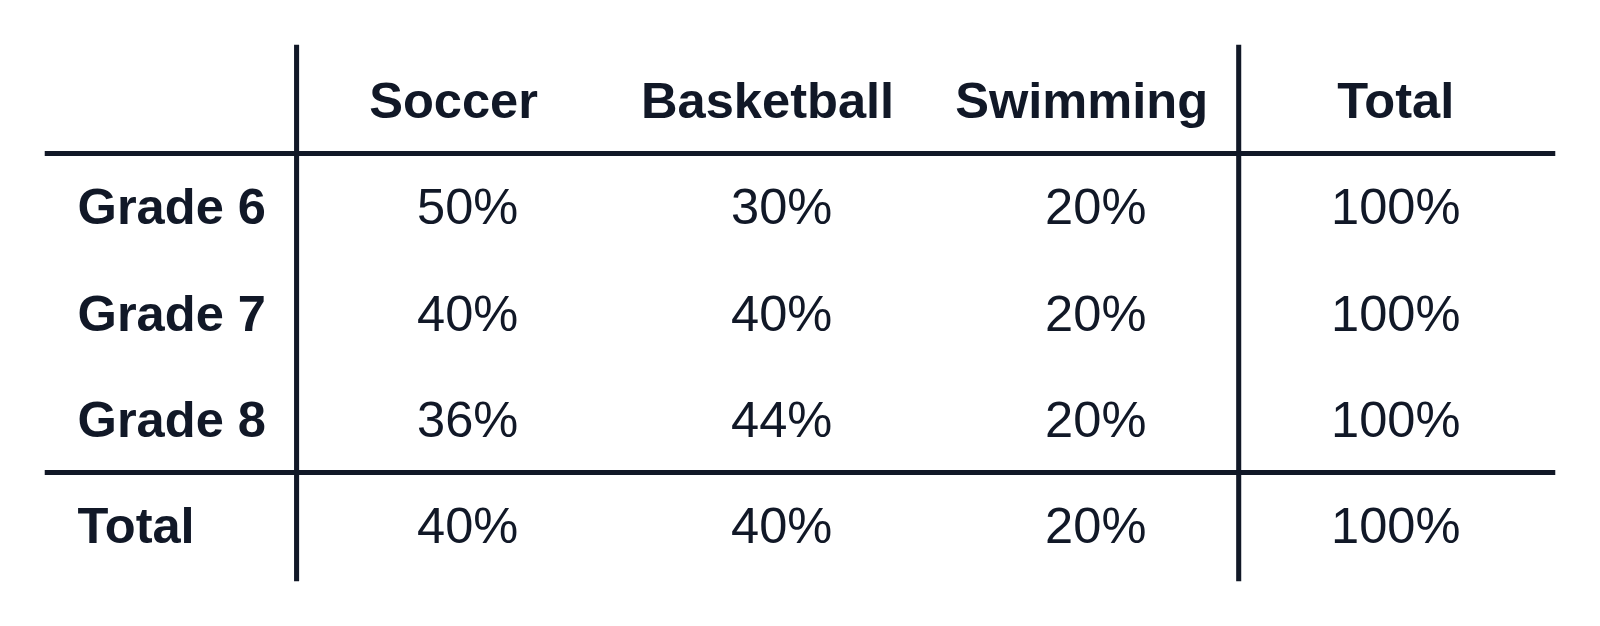
Editing opens it in the Two-Way Table Generator with these settings, to change anything and copy or download your own.
Free to use in your tests, worksheets, slides or anything else, no credit needed. Public domain under CC0 1.0. How to reuse our figures
More Two-Way Table examples
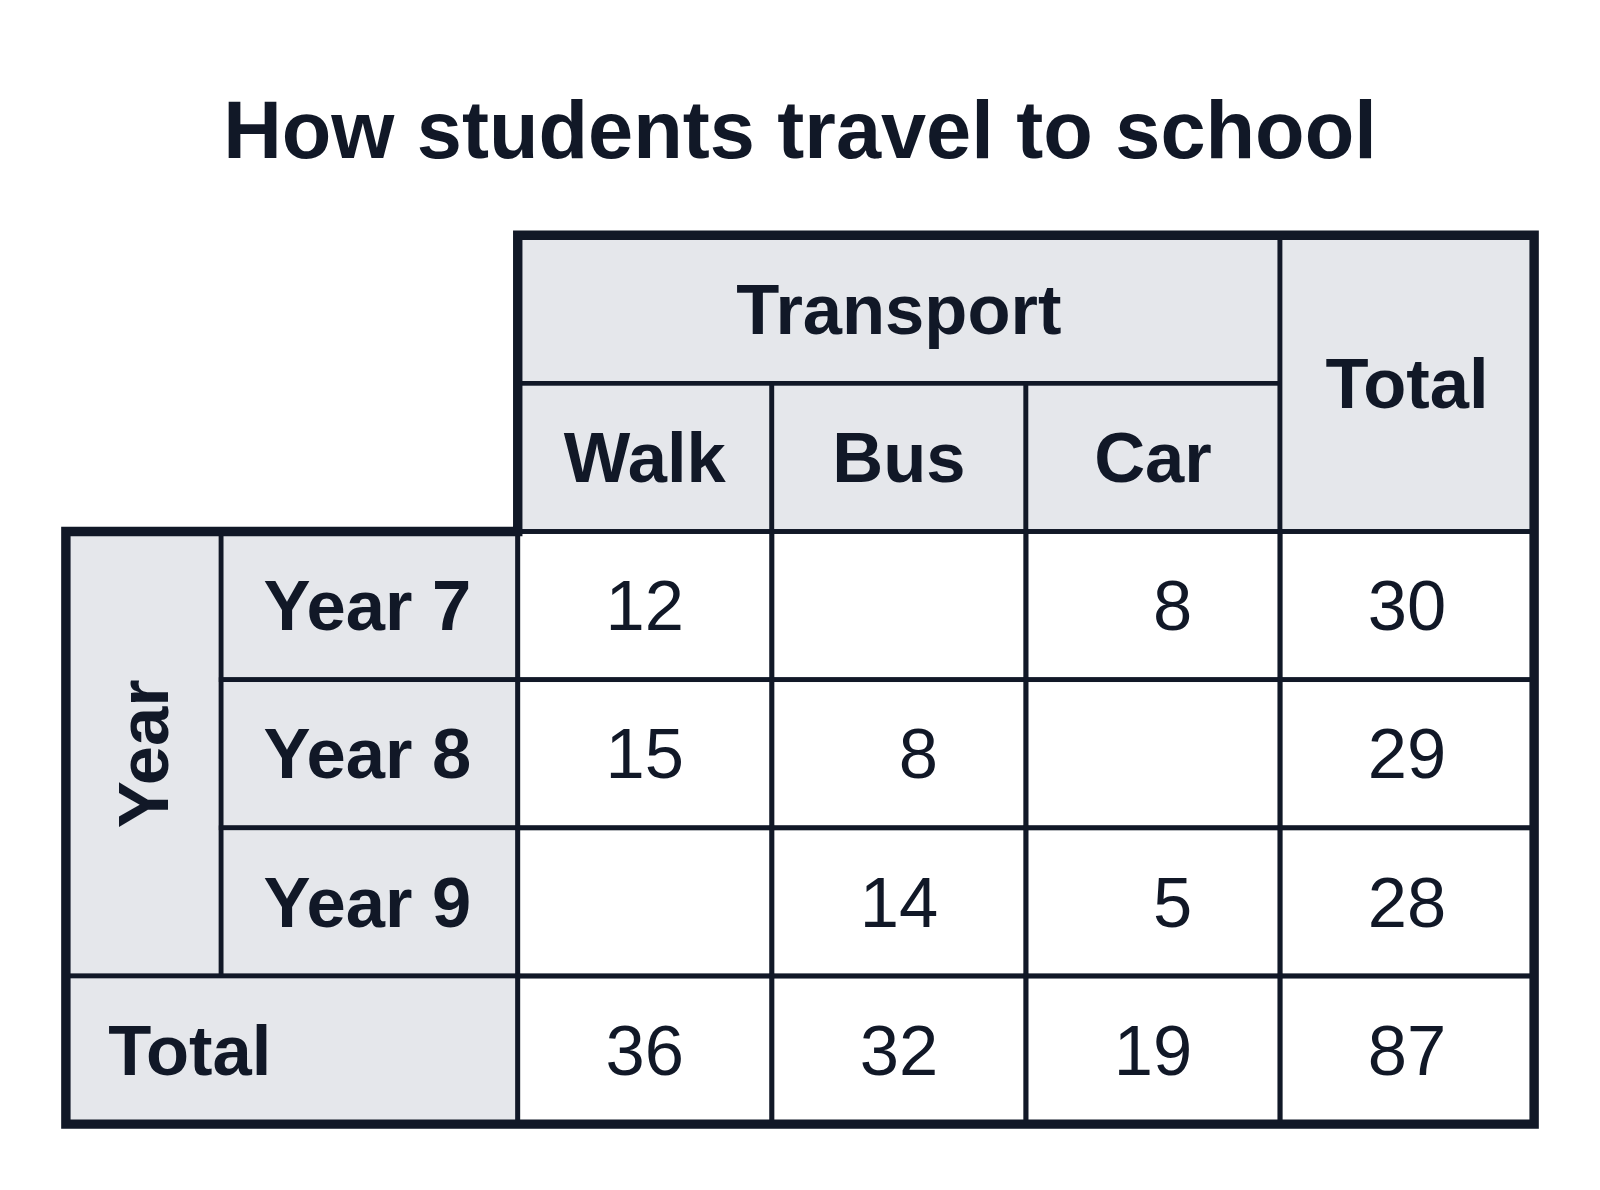 Two-way table: how students travel to school, with gaps to fill
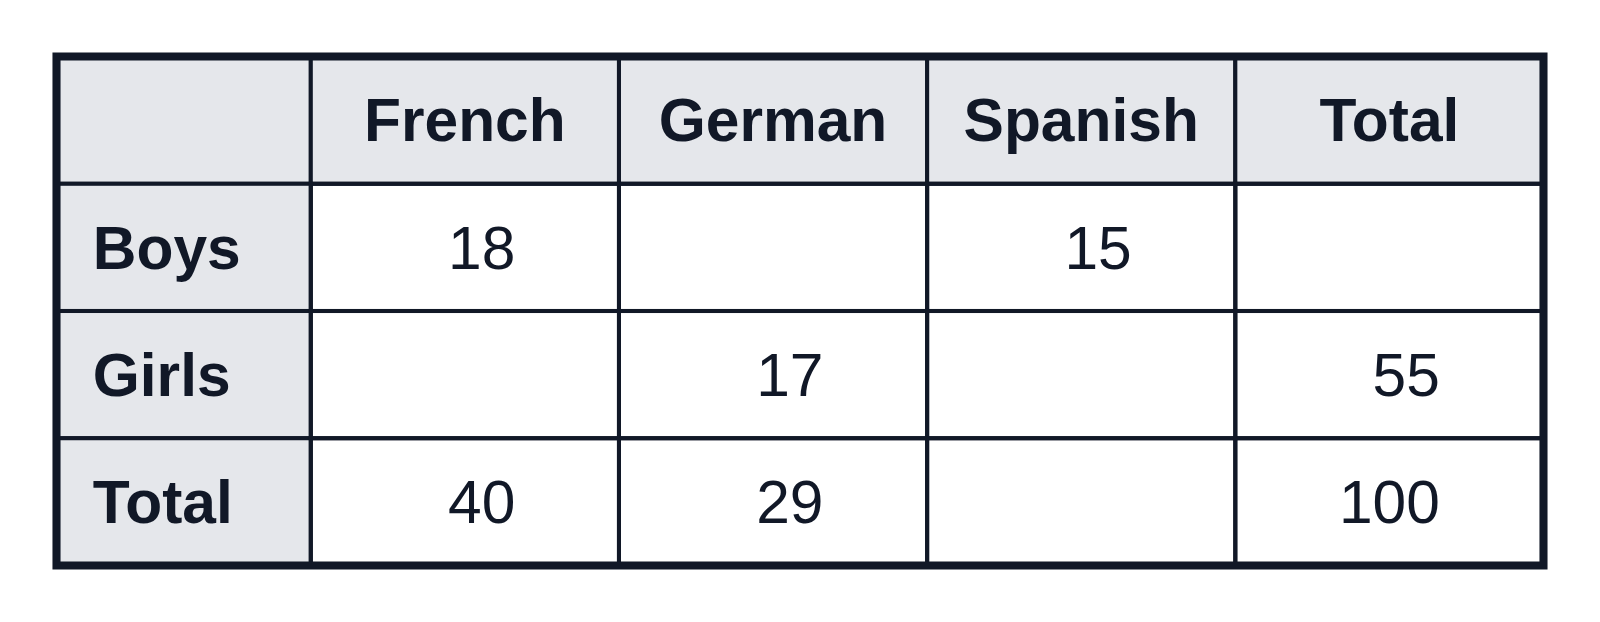 Two-way table gap-fill: boys’ and girls’ language choices
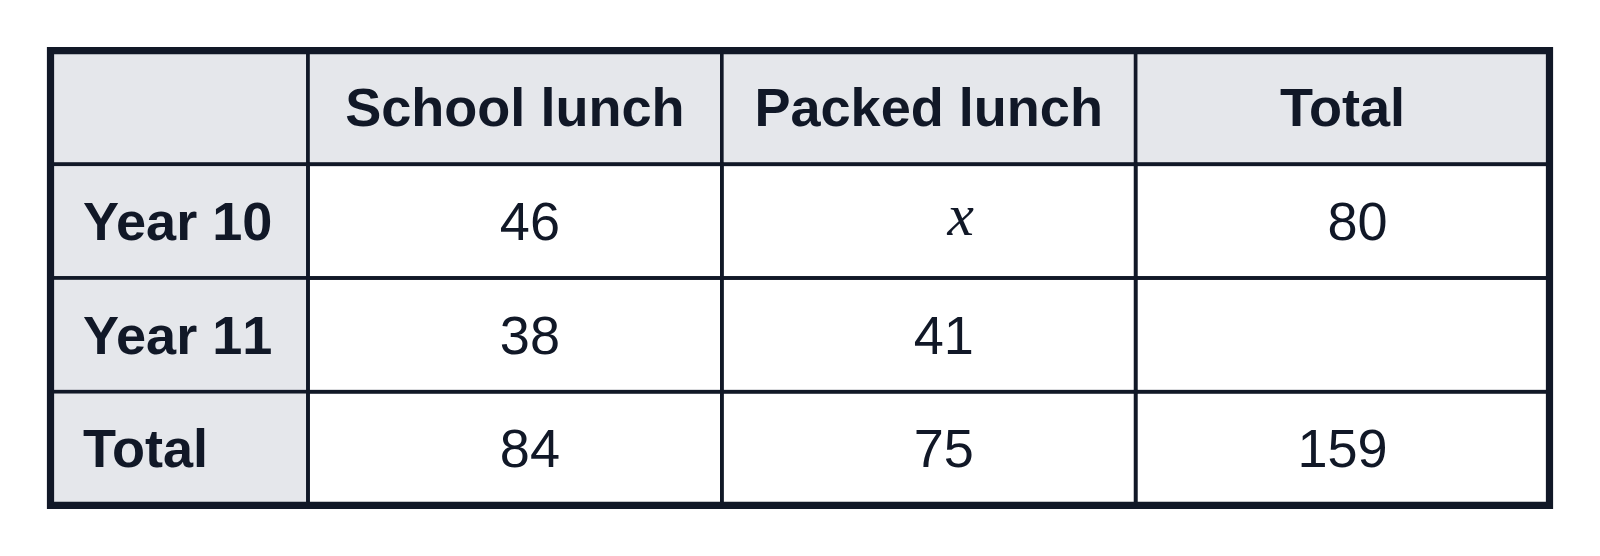 Two-way table with an unknown, x
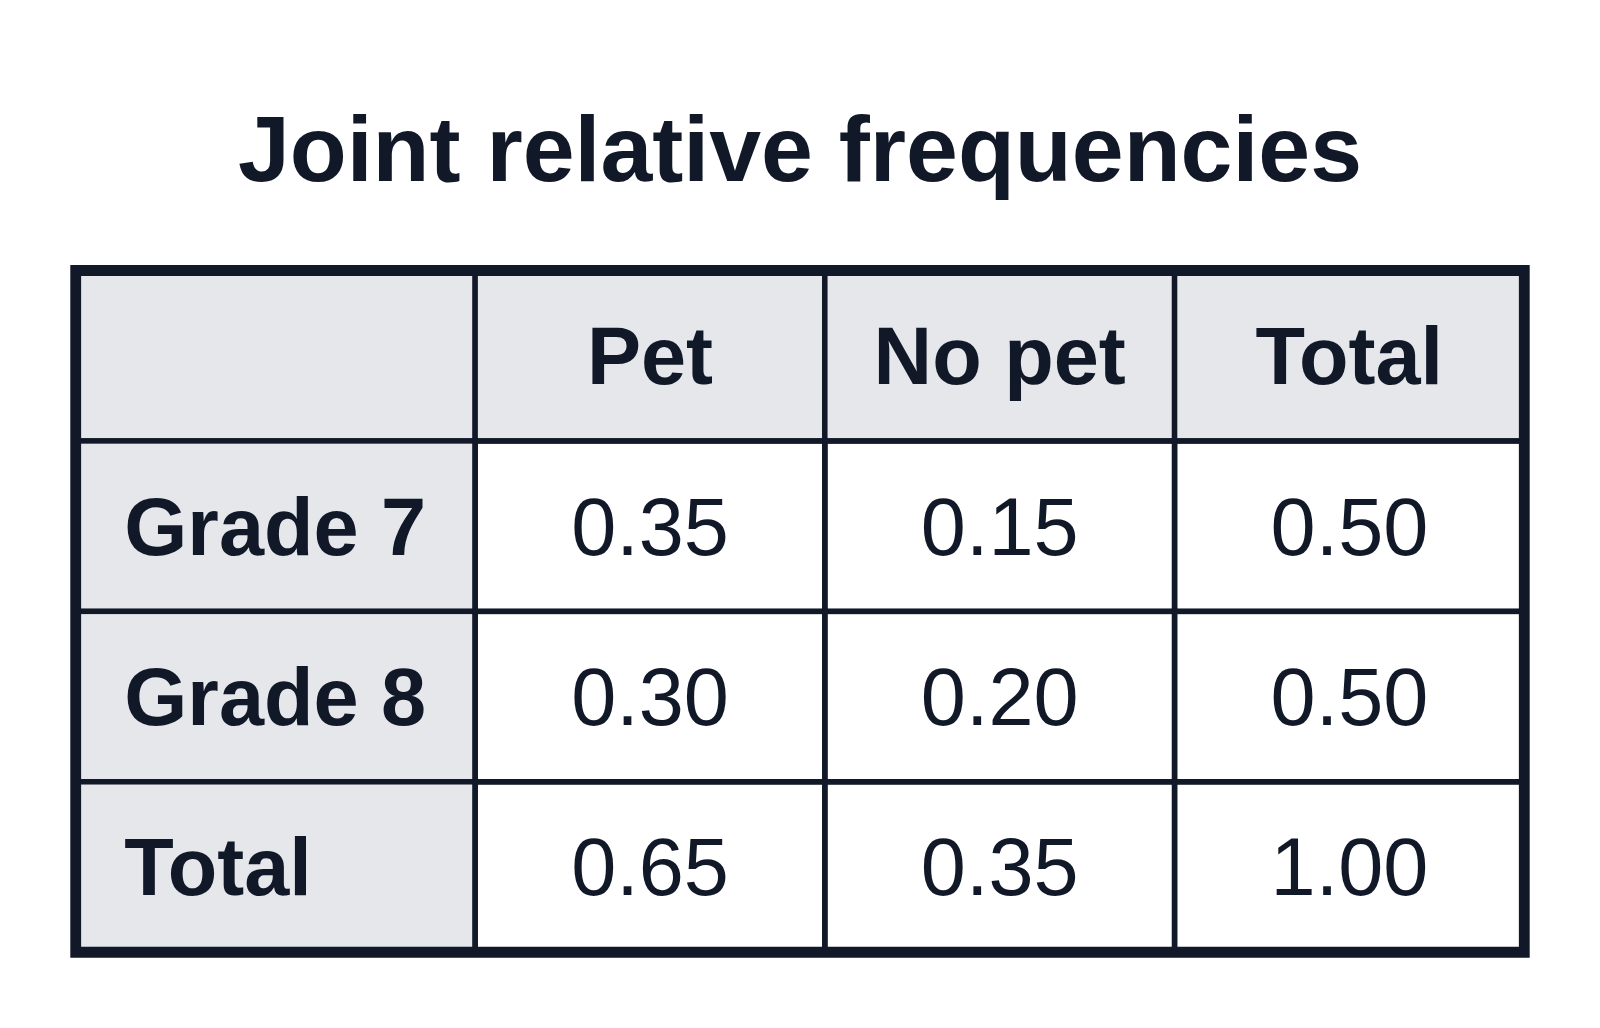 Joint relative frequency table: pets by grade
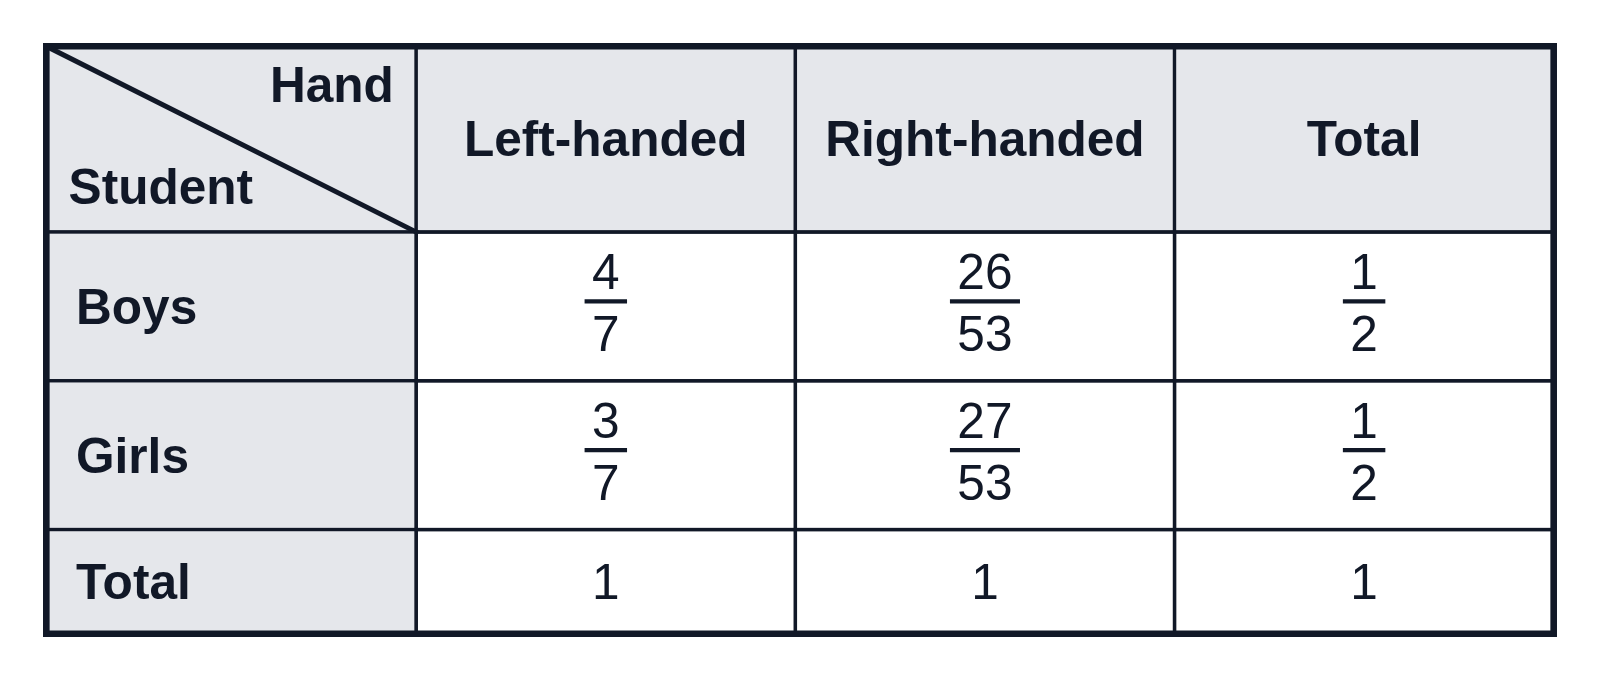 Relative frequency table as fractions: left- and right-handed students
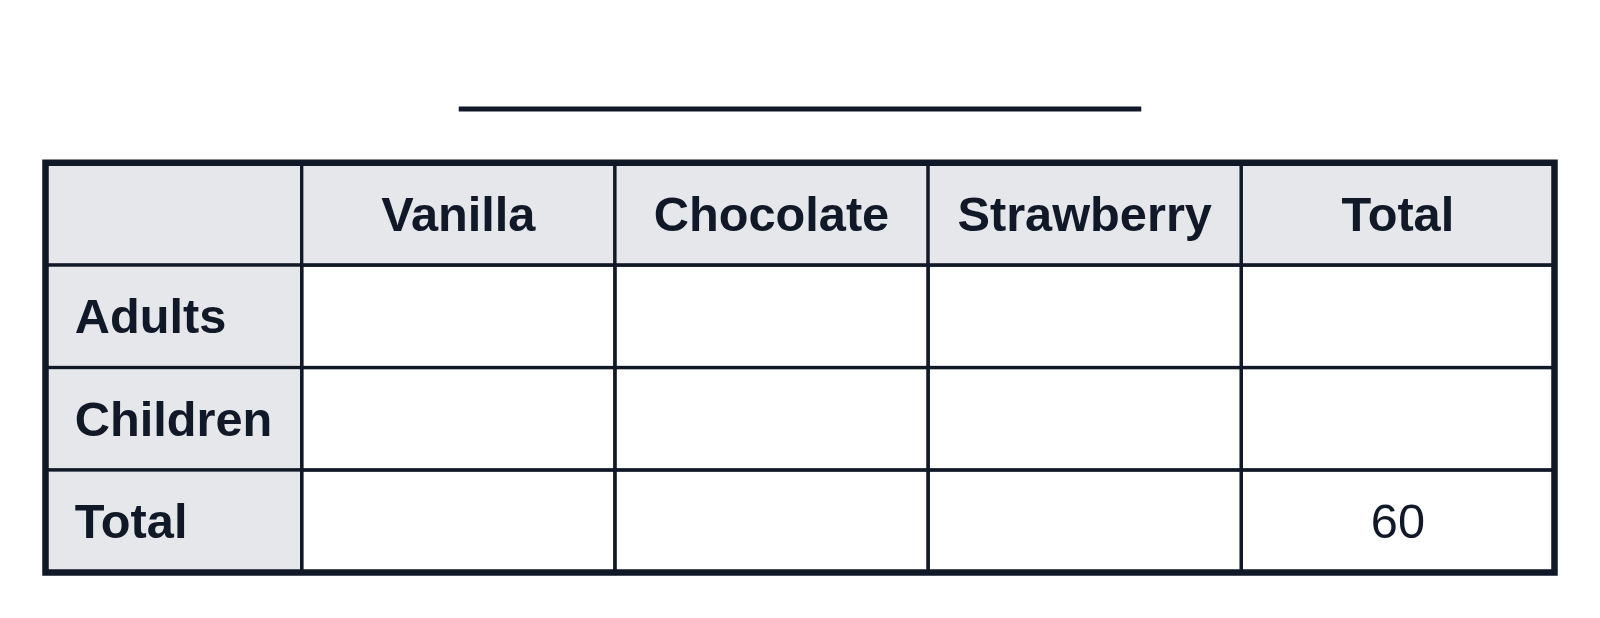 Blank two-way table to complete from a description