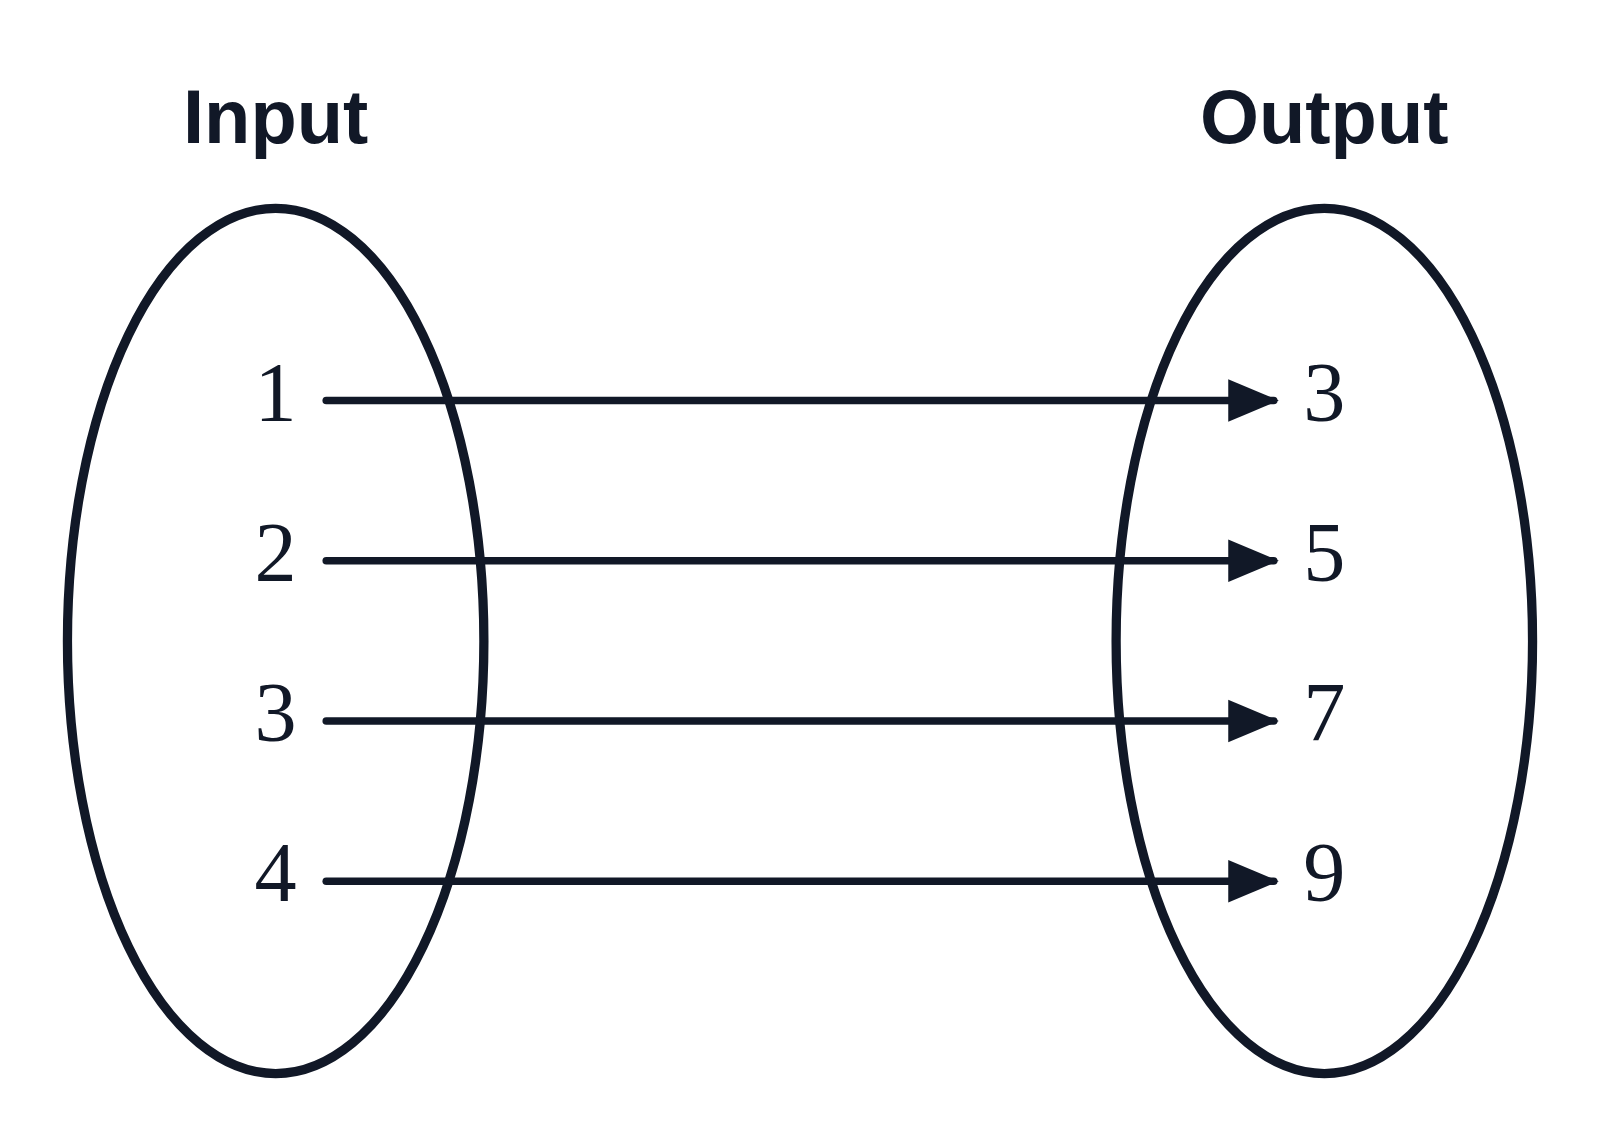
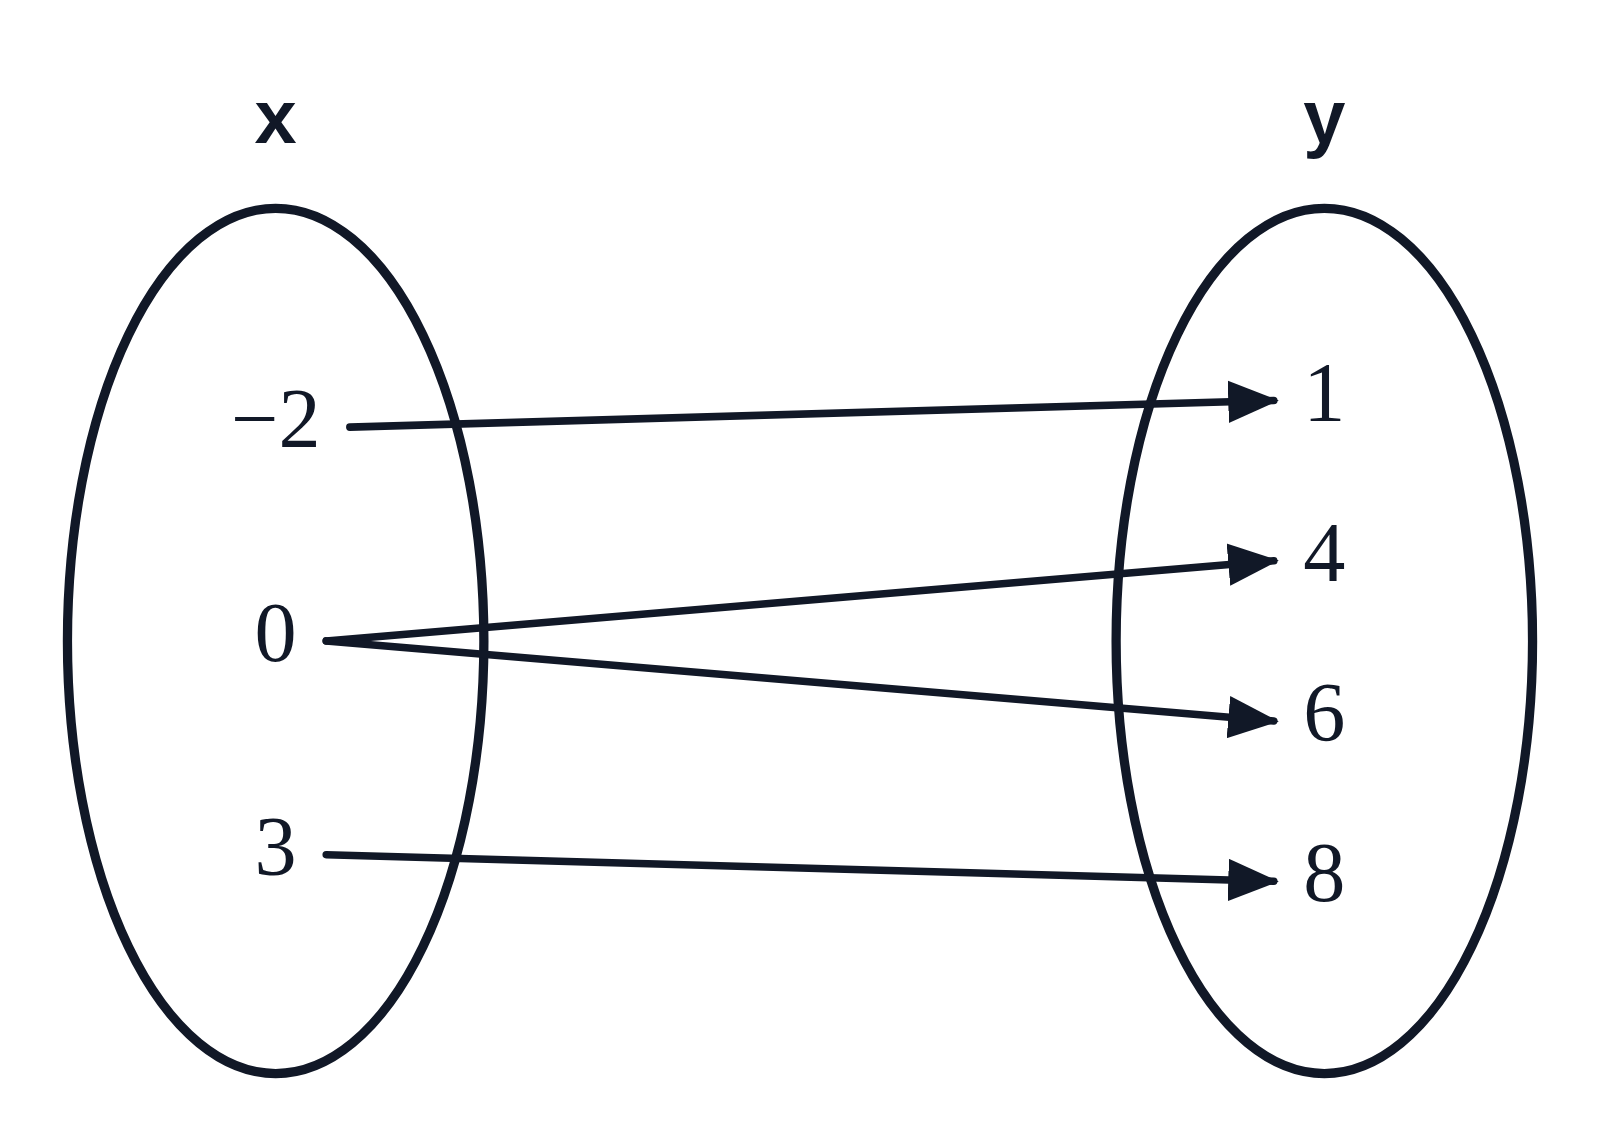
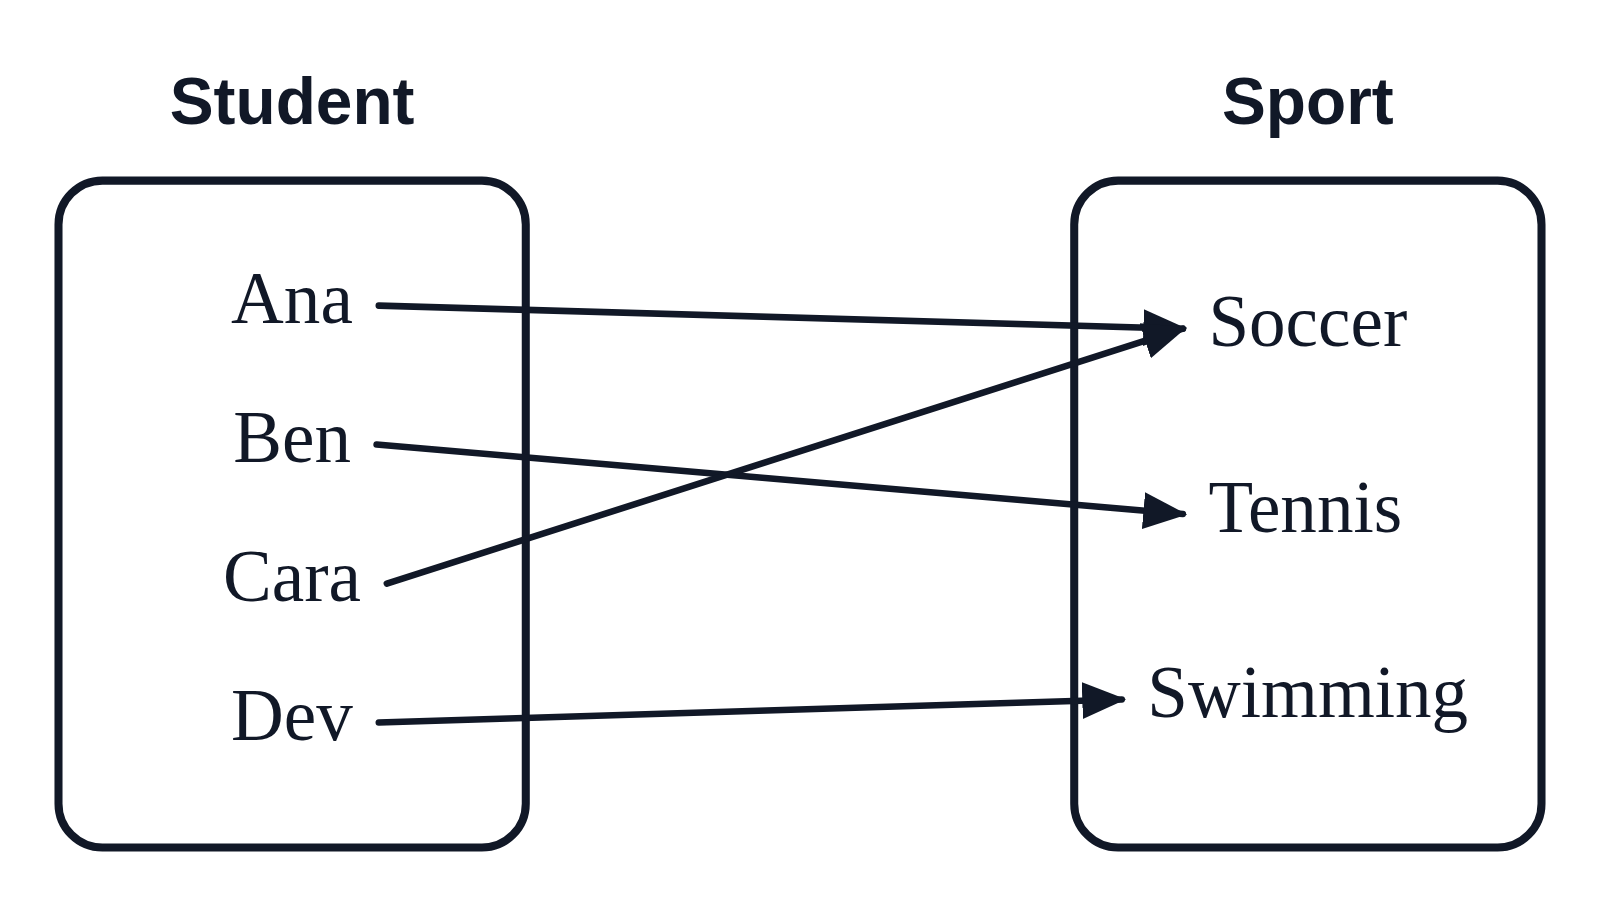
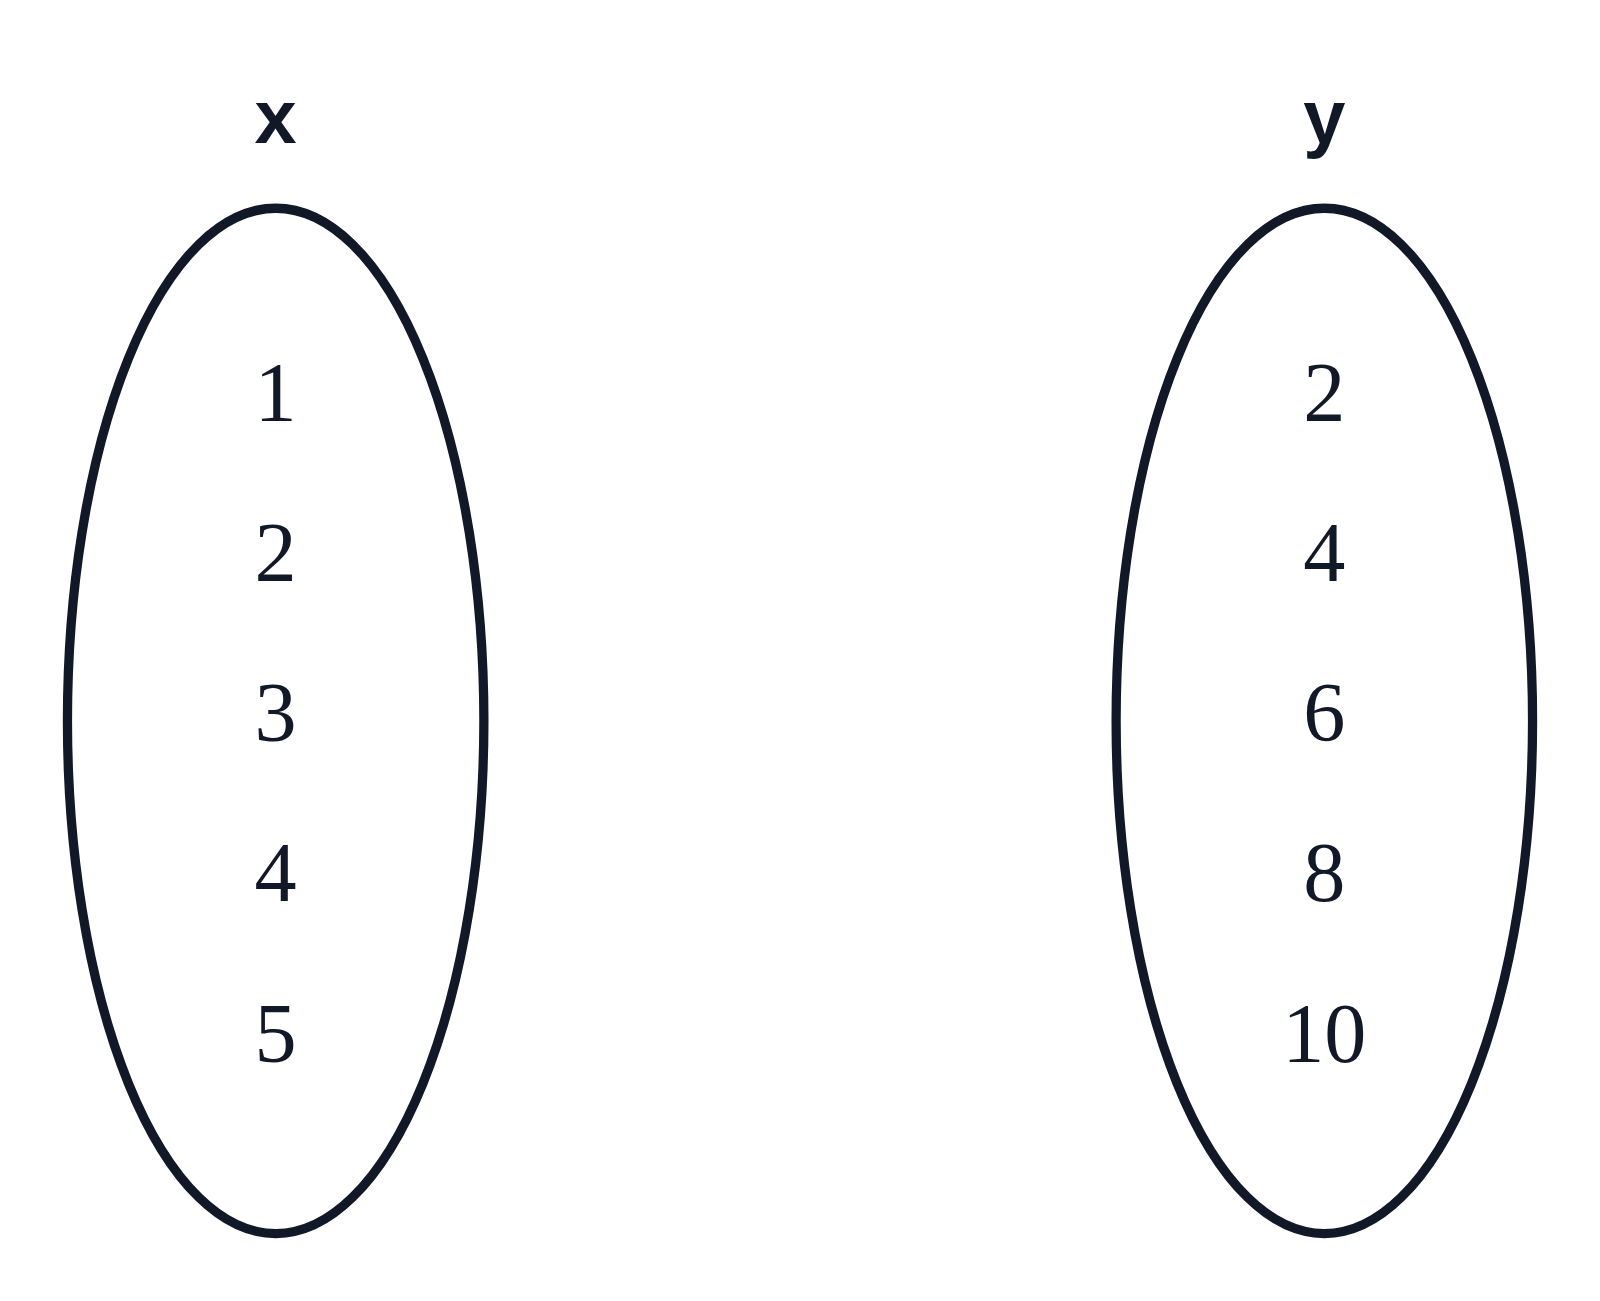
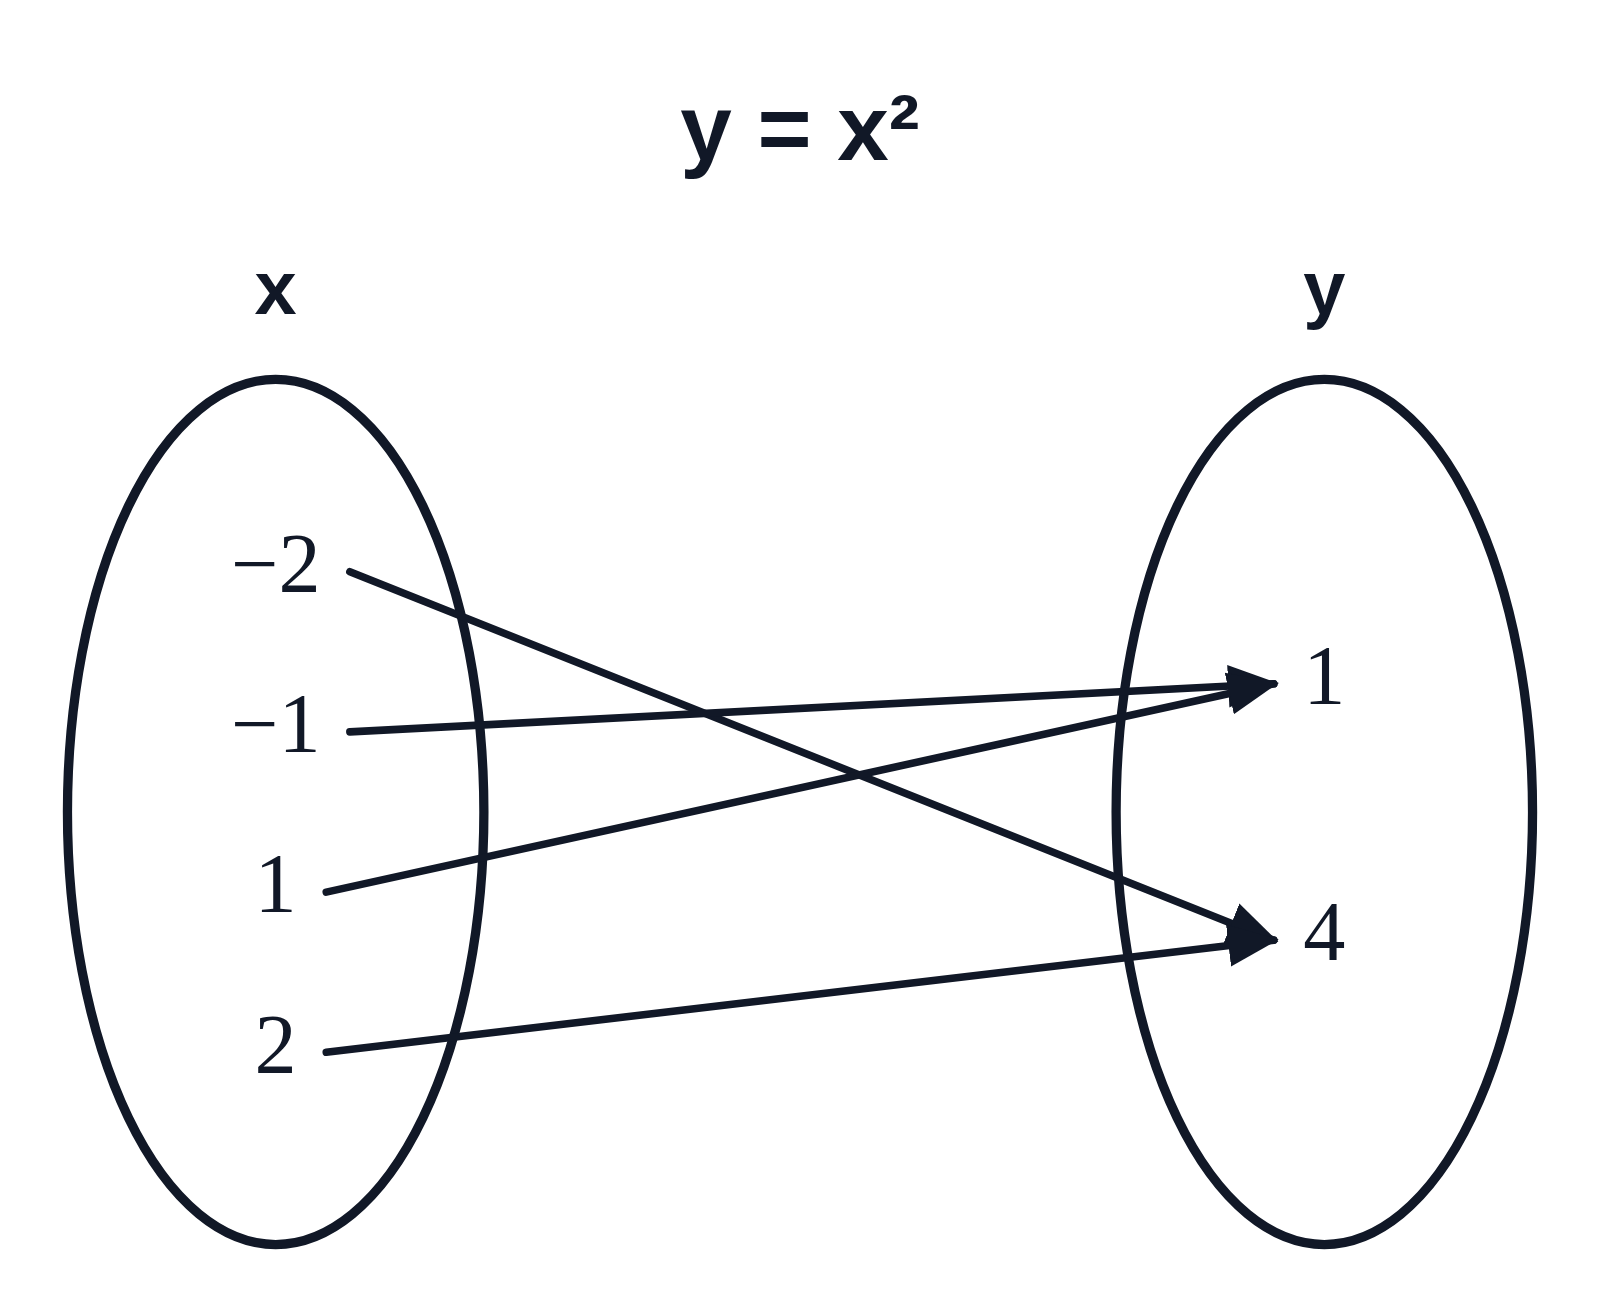
Mapping diagram of y = x², a function that isn’t one-to-one
An example figure from the Mapping Diagram Generator.
Editing opens it in the Mapping Diagram Generator with these settings, to change anything and copy or download your own.
Answer key
- A function: every input goes to exactly one output.
- Ordered pairs: (−2, 4), (−1, 1), (1, 1), (2, 4)
Free to use in your tests, worksheets, slides or anything else. Open source under Apache 2.0. How to reuse our figures